

Santos Limited (STS1) Q2 2026 Earnings Report
DE:STS1 Q2 2026 EPS Results
- Actual EPS
- EUR 0.10
- Consensus EPS
- EUR 0.09
- Beat/Miss
- Beat by +EUR 0.00
- One Year Ago EPS
- EUR 0.14
DE:STS1 Q2 2026 Revenue Results
- Actual Revenue
- EUR 2.40B
- Expected Revenue
- EUR 1.20B
- Beat/Miss
- Beat by +EUR 1.20B
- YoY Revenue Growth
- -6.94%
Earnings Announcement Details
- Quarter
- Q2 2026
- Date
- 08/18/2026
- Time
- After Close
- Conference Call
- Tuesday, August 18, 2026
Santos Limited's next earnings date is estimated for February 23, 2027, based on past reporting schedules.
Q2 2026 Earnings Call Audio
Q2 2026 Earnings Slide Deck
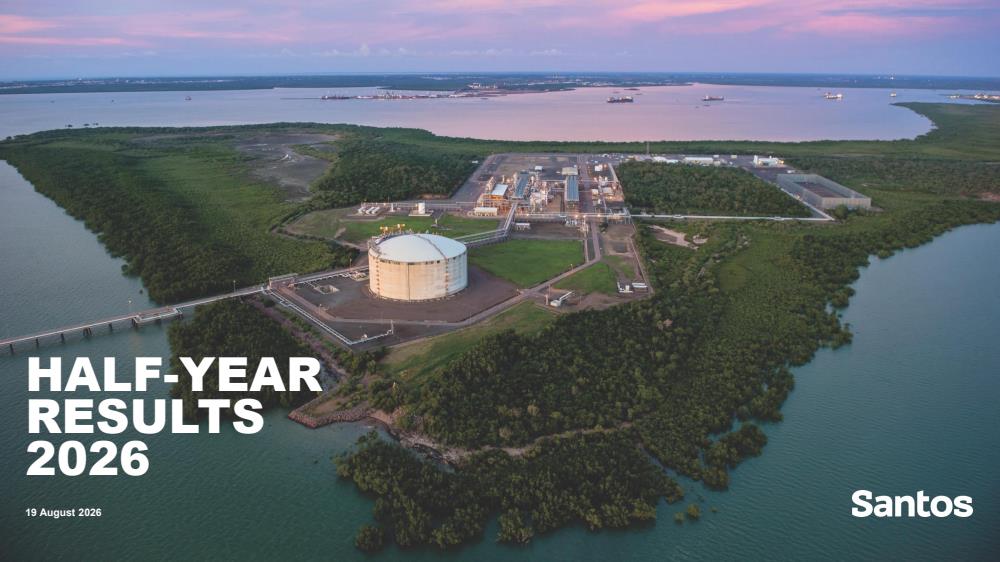
Q2 2026 Earnings Call Summary
The call presents a constructive and forward-looking picture: Santos brought major growth projects online (Pikka, Barossa), delivered strong plant reliability and safety, declared a dividend, and set clear targets (breakeven $45–$50/bbl, $2.5bn net debt reduction by 2030). Near-term H1 cash generation was constrained by expected commissioning costs, cargo timing and an underlift position, and gearing remains above target, but management expects these effects to unwind and for materially stronger cash generation in H2 as Barossa and Pikka ramp towards plateau and realized LNG pricing improves. Overall the positives (project starts, rising H2 guidance, operational reliability, pricing tailwinds and disciplined capital framework) outweigh the near-term lowlights tied largely to timing and commissioning.
The guidance from the call was that Santos expects materially stronger H2 cash generation with second‑half production ~20–30% higher than H1, supported by July’s stronger performance, and the Board declared an interim dividend of USD 0.116/share; H1 results were sales revenue $2.6bn, EBITDAX $1.6bn and free cash flow from operations $378m, with H1 production 45.6 million boe (up 3% y/y). Key operational targets include Pikka ramping from ~23,000 bbl/d gross in H1 to an ~80,000 bbl/d gross plateau by end‑Q3 (first cargo 450,000 barrels lifted), Barossa’s six wells at ~300 mmscfd each with Barossa production ~550 mmscfd rising to ~600 mmscfd by quarter‑end and an ~8‑day cargo cadence, LNG sales 7.7 Mt gross, H1 LNG realized $10.95/MMBtu and crude realized ~$92/bbl, unit production cost $7.53/boe (target < $7/boe over time) and LNG upstream unit cost $6.80/boe. Balance sheet and risk metrics: net debt ≈ $6bn, liquidity $3.8bn, gearing 28.1% incl leases (23.2% excl) with no maturities before Sep‑2027, target gearing 15–25% and $2.5bn net‑debt reduction by 2030; free‑cash‑flow breakeven $45–50/bbl to 2030 (operational breakeven < $35/bbl) and sensitivity that each $10 Brent above breakeven lifts FCF from ~ $400m today to ~$550–600m at plateau. H2 hedges: 11.5m bbl zero‑cost collars (floor $67.10, avg cap $98.59); FX hedges AUD975m at $0.643 (H2) and ~AUD1.5bn at $0.658 (2027).
- Revenue, EBITDAX and DividendSales revenue of $2.6 billion, EBITDAX of $1.6 billion and declared interim dividend of USD 0.116 per share; free cash flow from operations was $378 million (affected by commissioning and timing items).
- Production and Growth: Barossa and Pikka OnlineH1 production 45.6 million boe, up 3% year-on-year. Barossa now contributing (approx. 550 mmscfd increasing to ~600 mmscfd by end of quarter) and each of 6 Barossa wells confirmed at 300 mmscfd capacity. Pikka achieved first oil in May, was at ~23,000 bpd gross at end of H1, and first crude cargo (450,000 barrels) lifted; path to 80,000 bpd gross plateau targeted by end of the quarter. Company expects H2 production to be ~20%–30% higher than H1.
- Strong Operational Reliability and SafetyNo lost time injuries and no Tier 1 process safety incidents in H1; lost time injury rate better than IOGP global average since 2022. Darwin LNG, DLNG and GLNG plants delivered 100% reliability in H1; PNG LNG and other plants >99% reliability. Varanus Island ran at ~97% reliability.
- Portfolio Quality and Pricing RealizationsLNG realized $10.95 per mmBtu and crude oil realized $92 per barrel across the portfolio in H1; ~80% of contracted position indexed to JCC/oil. JCC trading above $100/bbl in market, with most LNG contracts having ~3-month lag expected to lift realized pricing in H2.
- Lower Unit Costs and Margin StrengthEBITDAX margin of 59% in H1; unit production cost $7.53/boe in H1 with a target to trend below $7/boe over time. Management targets free cash flow breakeven of $45–$50/bbl through to 2030 and < $35/bbl from operations, and reports ~30% margin expansion since 2016 driven by cost and capital discipline.
- Liquidity, Ratings and HedgingLiquidity of $3.8 billion (cash + undrawn facilities), net debt ~ $6.0 billion; all three rating agencies affirmed investment-grade (Moody's Baa3 positive outlook, Fitch BBB, S&P BBB-). Oil hedges for H2: 11.5 million barrels via zero-cost collars (floor $67.10, avg cap $98.59); FX hedges and H1 FX gains of $75 million.
- Operational and Project MilestonesGLNG shipped its 1,000th LNG cargo; DLNG and GLNG plant reliability 100%; 111 cargoes shipped across Australia and PNG in H1; Roma record of 230 TJ/day; GLNG drilling program delivering ~100 $/m cost reductions per extended reach well; Moomba CCS cumulative storage ~2.3 million tons CO2e.
- High-Return Investment DecisionsFID taken on Agogo Production Facility tie-in targeting IRR >50% and payback <4 years; PNG LNG oil infill drilling FID taken; Moomba Central Optimization FID targeting >$600 million CapEx/OpEx savings and up to $3/boe reduction in unit production costs.
DE:STS1 Earnings History
| Report Date | Fiscal Quarter | Forecast / EPS | Last Year's EPS | EPS YoY Change | Press Release |
|---|---|---|---|---|---|
| Feb 23, 2027 | 2026 (Q4) | 0.35- | 0.1 | ― | ― |
| Aug 18, 2026 | 2026 (Q2) | 0.090.10 | 0.14 | -30.13% (-0.04) | |
| Feb 17, 2026 | 2025 (Q4) | 0.110.10 | 0.15 | -31.18% (-0.05) | |
| Aug 24, 2025 | 2025 (Q2) | 0.130.14 | 0.17 | -20.00% (-0.03) | |
| Feb 18, 2025 | 2024 (Q4) | 0.160.15 | 0.17 | -10.53% (-0.02) | |
| Aug 20, 2024 | 2024 (Q2) | 0.170.17 | 0.21 | -18.75% (-0.04) | |
| Feb 20, 2024 | 2023 (Q4) | 0.190.17 | 0.32 | -47.22% (-0.15) | |
| Aug 22, 2023 | 2023 (Q2) | 0.210.21 | 0.31 | -30.23% (-0.09) | |
| Feb 21, 2023 | 2022 (Q4) | 0.360.32 | 0.26 | 23.71% (+0.06) | |
| Aug 16, 2022 | 2022 (Q2) | 0.330.31 | 0.15 | 103.55% (+0.16) |
The table shows recent earnings report dates and whether the forecast was beat or missed. See the change in forecast and EPS from the previous year.