

Russel Metals (RMZ) Q2 2026 Earnings Report
DE:RMZ Q2 2026 EPS Results
- Actual EPS
- EUR 0.91
- Consensus EPS
- EUR 0.70
- Beat/Miss
- Beat by +EUR 0.21
- One Year Ago EPS
- EUR 0.68
DE:RMZ Q2 2026 Revenue Results
- Actual Revenue
- EUR 1.06B
- Expected Revenue
- EUR 948.23M
- Beat/Miss
- Beat by +EUR 108.64M
- YoY Revenue Growth
- +37.08%
Earnings Announcement Details
- Quarter
- Q2 2026
- Date
- 08/06/2026
- Time
- After Close
- Conference Call
- Thursday, August 6, 2026
Russel Metals's next earnings date is estimated for November 4, 2026, based on past reporting schedules.
Q2 2026 Earnings Call Audio
Q2 2026 Earnings Slide Deck
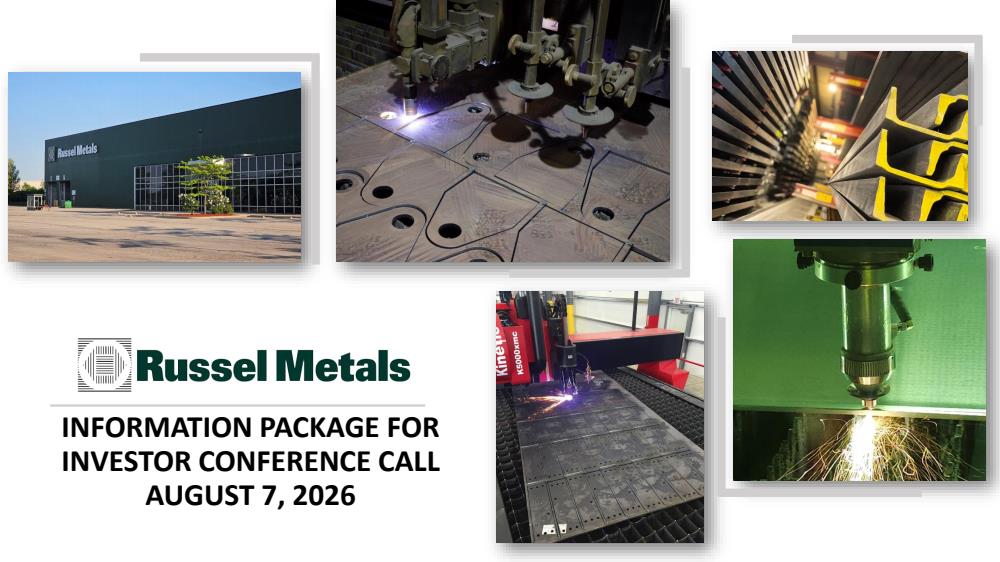
Q2 2026 Earnings Call Summary
The call conveyed a strongly positive operational and financial quarter: record revenues, shipments, improved margins, significant adjusted EBITDA and EPS uplift, industry-leading ROIC, strong liquidity and disciplined capital allocation. Challenges were noted (Klockner's lower margin profile, inventory dollar growth, a one-time stock‑based compensation mark, modest working capital use, and potential timing risks if prices plateau). Overall, management's messaging emphasized durable demand, improving market breadth, and the ability to translate higher volumes and pricing into outsized earnings — with clear plans to narrow Klockner margin gaps and selectively deploy capital.
Management guided that Q3 2026 should be at least in line with the first half and, in fact, better than Q3 2025, noting July margins were similar to June (and June was above the Q2 average) and activity has continued into early Q3 despite normal seasonal headwinds. Key metrics cited supporting that outlook include record consolidated revenue of $1.7B and service‑center shipments above 500k tons (tons +6% vs Q1; same‑store +6% vs Q2 2025), a 130‑bp gross margin improvement Q2 vs Q1 with service‑center gross margin of $529/ton (+$71/ton vs Q1), Q2 adjusted EBITDA $154M (LTM EBITDA >$400M), EPS $1.43 (GAAP) / adjusted $1.63, ROIC 24% annualized (23% YTD), inventory turns 4.4 (from 4.2), Q2 CapEx $18M with expected pickup as annual CapEx averages ~ $100M (~$25M/quarter) into late‑2026/2027, liquidity >$500M with net debt ~$144M, quarterly dividend $0.44, $48M cash used for working capital in Q2, and continued NCIB activity (cumulative 8.7M shares for $333M at an average $38.13).
- Record Quarterly RevenueConsolidated revenues reached a quarterly record of $1.7 billion in Q2; revenues were up approximately 17% sequentially and about 37% year-over-year.
- Strong Adjusted EBITDA and EPS PerformanceAdjusted EBITDA was $154 million in Q2 (up from $93 million in Q1); adjusted EPS was $1.63 (roughly double Q1); trailing 12-month (LTM) EBITDA exceeded $400 million.
- Service Center Volume and Margin StrengthService centers shipped a record >500,000 tons in Q2 (first time >500k tons/quarter), same-store tonnage up ~6% year-over-year; gross margin per ton rose to $529, a $71/ton increase versus Q1, and overall service center gross margin improved ~130 basis points quarter-over-quarter.
- Klockner Acquisition ImpactFormer Klockner branches generated about $16 million of EBITDA in Q2 (double Q1); cumulative 6-month contribution vs $128 million purchase price equates to an over 30% annualized return on invested capital so far.
- Return on Invested Capital and ProfitabilityReturn on invested capital was 24% annualized in the quarter and 23% annualized year-to-date 2026, described as industry-leading and above the company's cycle target.
- Balance Sheet and Liquidity StrengthNet debt was only $144 million at quarter end, liquidity exceeded $500 million, and net debt was reduced by about $26 million since last quarter, providing significant dry powder for opportunities.
- Shareholder Returns and Capital AllocationQ2 dividends of $24 million were returned; quarterly dividend raised to $0.44 per share in June and re-declared; NCIB activity (since 2022) repurchased 8.7 million shares for $333 million (average $38.13), reducing share count by ~14%.
- Inventory & Working Capital EfficiencyInventory turns improved to 4.4 in Q2 from 4.2 in Q1 despite tight inventories; working capital usage was modest relative to past cycles even with a $48 million cash use in Q2 driven by pickup in activity.
- Capital Investment PlansQ2 CapEx was $18 million (similar to Q1); two $10 million modernization projects approved (one in Western Canada, one in U.S. South); management expects multiyear CapEx averaging ~ $100 million per year (~$25M per quarter on average) over the cycle.
DE:RMZ Earnings History
| Report Date | Fiscal Quarter | Forecast / EPS | Last Year's EPS | EPS YoY Change | Press Release |
|---|---|---|---|---|---|
| Nov 04, 2026 | 2026 (Q3) | 0.95- | 0.4 | ― | ― |
| Aug 06, 2026 | 2026 (Q2) | 0.700.91 | 0.68 | 33.64% (+0.23) | |
| May 05, 2026 | 2026 (Q1) | 0.480.83 | 0.48 | 73.33% (+0.35) | |
| Feb 11, 2026 | 2025 (Q4) | 0.340.35 | 0.3 | 17.02% (+0.05) | |
| Nov 05, 2025 | 2025 (Q3) | 0.430.40 | 0.38 | 6.78% (+0.03) | |
| Aug 07, 2025 | 2025 (Q2) | 0.660.68 | 0.54 | 27.38% (+0.15) | |
| May 06, 2025 | 2025 (Q1) | 0.370.48 | 0.52 | -8.54% (-0.04) | |
| Feb 12, 2025 | 2024 (Q4) | 0.310.30 | 0.5 | -39.74% (-0.20) | |
| Nov 06, 2024 | 2024 (Q3) | 0.390.38 | 0.63 | -40.40% (-0.26) | |
| Jul 31, 2024 | 2024 (Q2) | 0.540.54 | 0.87 | -38.69% (-0.34) |
The table shows recent earnings report dates and whether the forecast was beat or missed. See the change in forecast and EPS from the previous year.