


Medexus Pharmaceuticals Inc earnings date
Medexus Pharmaceuticals Inc (P731) Q2 2027 Earnings Report
DE:P731 Q2 2027 EPS Results
- Actual EPS
- EUR 0.03
- Consensus EPS
- EUR 0.02
- Beat/Miss
- Beat by +EUR 0.01
- One Year Ago EPS
- -EUR 0.01
DE:P731 Q2 2027 Revenue Results
- Actual Revenue
- EUR 25.89M
- Expected Revenue
- EUR 24.40M
- Beat/Miss
- Beat by +EUR 1.50M
- YoY Revenue Growth
- +19.57%
Earnings Announcement Details
- Quarter
- Q2 2027
- Date
- 11/11/2026
- Time
- After Close
- Conference Call
- Wednesday, November 11, 2026
Medexus Pharmaceuticals Inc's next earnings date is estimated for February 10, 2027, based on past reporting schedules.
Q2 2027 Earnings Call Audio
No earnings call audio is available for this earnings event.
Q2 2027 Earnings Slide Deck
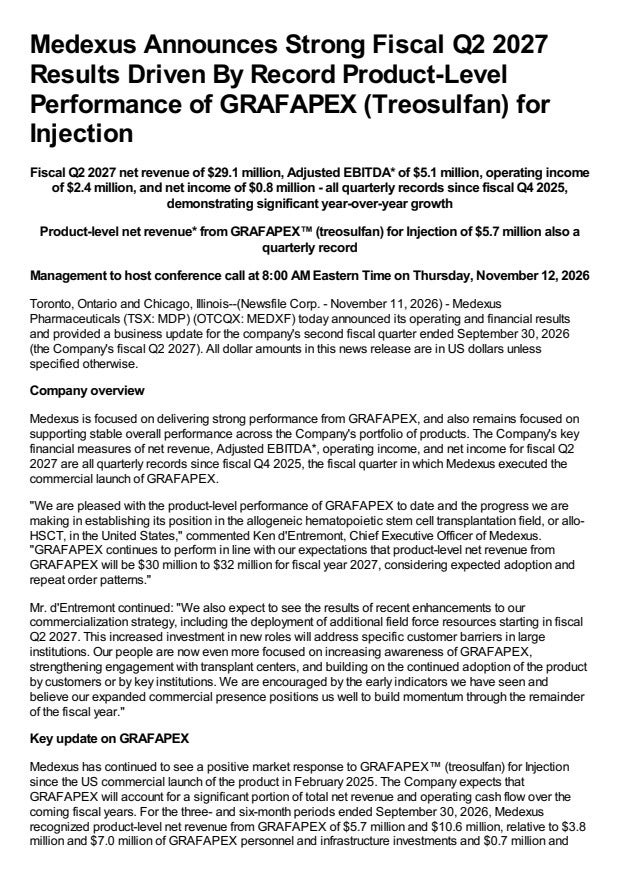
Q2 2027 Earnings Call Summary
The call was strongly positive overall. Highlights included double-digit revenue and adjusted EBITDA growth, a return to net income, higher operating cash flow, accelerating GRAFAPEX demand and adoption, maintained fiscal 2027 guidance, and confidence in the long-term GRAFAPEX and UM171 opportunities. The main challenges were lower adjusted gross margin, generic competition affecting Rupall, higher SG&A and net debt, and uncertainty around the Canadian regulatory pathway and timing for Zemcelpro.
Medexus said product level net revenue of GRAFAPEX for fiscal year 2027 will be between 30% and $32 million and continues to expect GRAFAPEX to achieve annual product level net revenue of approximately $100 million to $175 million within 5 years after commercial launch; management also expects increasing GRAFAPEX product level net revenue to have a positive effect on operating cash flow, said revenue acceleration will be spread over the 2 quarters, with significant evidence presented at ASH in mid early December and strong uptake through fourth quarter, and gave UM171 launch dates of between 2028 and 2031, I believe.
- Revenue Growth Driven by GRAFAPEX and IXINITYFiscal Q2 2027 net revenue increased to $29.1 million from $24.7 million in the prior-year period, a $4.4 million increase of approximately 17.8%. Management stated that the increase was primarily due to higher product-level net revenue from GRAFAPEX and IXINITY.
- Improved ProfitabilityAdjusted EBITDA increased to $5.1 million from $4.4 million, an increase of $700 thousand or approximately 15.9%. Net income was $800 thousand compared with a net loss of $300 thousand in Q2 2026, while operating income increased to $2.4 million from $1.4 million.
- Strong Operating Cash FlowCash provided by operating activities increased to $5.4 million from $3.3 million in the prior-year period, an increase of $2.1 million or approximately 63.6%. Management also expects increasing GRAFAPEX product-level net revenue to have a positive effect on operating cash flow over time.
- GRAFAPEX Fiscal 2027 Revenue Guidance MaintainedGRAFAPEX generated $5.7 million in product-level net revenue in fiscal Q2 2027, compared with approximately $3.8 million in related personnel and infrastructure investments plus $700 thousand in cost of product and amortization. Management maintained its expectation for fiscal 2027 GRAFAPEX product-level net revenue of between $30 million and $32 million.
- Strong GRAFAPEX Underlying Patient DemandUnderlying patient demand for GRAFAPEX was $5.6 million in fiscal Q2 2027, representing growth of 16% compared with $4.8 million in fiscal Q1 2027 and 156% compared with $2.1 million in fiscal Q2 2026.
- GRAFAPEX Commercial Adoption ExpandingAs of September 30, 2026, 86 individual health care institutions had ordered GRAFAPEX for procedures, and 38 of those institutions had placed multiple orders during the most recently completed six-month period. Management also described payer coverage, access trends, and early patient-level demand indicators as highly encouraging.
- Expected Long-Term GRAFAPEX OpportunityBased on continued commercial traction, management expects GRAFAPEX to achieve annual product-level net revenue of approximately $100 million to $175 million within five years after commercial launch.
- Commercial Expansion and Expected Revenue AccelerationThe company has deployed a dedicated GRAFAPEX sales team and stated that early commercial indicators are trending positively. Management expects evidence generated in the U.S. market and shared beginning at ASH and through tandem to support adoption by institutions that have not yet adopted the drug and increased use among current adopters, with the expected inflection spread across the third and fourth fiscal quarters.
- Established Portfolio and Strategic Growth OpportunitiesManagement said the established product portfolio continues to provide a solid foundation, supported by sustained total underlying demand across key products. The company remains focused on continued GRAFAPEX commercialization and the longer-term potential of UM171 cell therapy in Canada.
- Gross Profit and Reported Gross Margin IncreasedGross profit increased to $16.3 million from $13.8 million in the prior-year period. Reported gross margin was 55.9%, compared with 55.7% in the same period last year.
- Financial Position Described as StrongManagement described the financial position as strong, supported by healthy operating cash flows and the continued contribution of the overall portfolio. Net debt to adjusted EBITDA was 0.97x as of September 30, 2026.
- UM171 and Canadian Cell-Therapy OpportunityMedexus reiterated that it is a strong supporter of UM171 and sees good potential for the product following its licensing of Canadian rights. Management also said the company is interested in pursuing a Canadian pathway for Zemcelpro that could make the product available to patients without a donor, subject to clarity from Health Canada.
DE:P731 Earnings History
| Report Date | Fiscal Quarter | Forecast / EPS | Last Year's EPS | EPS YoY Change | Press Release |
|---|---|---|---|---|---|
| Feb 10, 2027 | 2027 (Q3) | 0.06- | 0 | ― | ― |
| Nov 11, 2026 | 2027 (Q2) | 0.020.03 | -0.01 | 400.00% (+0.04) | |
| Aug 10, 2026 | 2027 (Q1) | 0.030.02 | 0.02 | 0.00% (+0.00) | |
| Jun 25, 2026 | 2026 (Q4) | -0.01-0.07 | -0.02 | -300.00% (-0.05) | |
| Feb 11, 2026 | 2026 (Q3) | -0.020.00 | 0.03 | -100.00% (-0.03) | |
| Nov 12, 2025 | 2026 (Q2) | -0.02-0.01 | 0 | ― | |
| Aug 12, 2025 | 2026 (Q1) | -0.030.02 | 0.07 | -75.00% (-0.05) | |
| Jun 25, 2025 | 2025 (Q4) | -0.06-0.02 | 0.03 | -164.52% (-0.05) | |
| Feb 05, 2025 | 2025 (Q3) | 0.030.03 | -0.02 | 250.00% (+0.05) | |
| Nov 07, 2024 | 2025 (Q2) | 0.020.00 | -0.05 | 100.00% (+0.05) |
The table shows recent earnings report dates and whether the forecast was beat or missed. See the change in forecast and EPS from the previous year.
