

OR Royalties (OM40) Q2 2026 Earnings Report
DE:OM40 Q2 2026 EPS Results
- Actual EPS
- EUR 0.29
- Consensus EPS
- EUR 0.28
- Beat/Miss
- Beat by +EUR 0.01
- One Year Ago EPS
- EUR 0.16
DE:OM40 Q2 2026 Revenue Results
- Actual Revenue
- EUR 86.48M
- Expected Revenue
- EUR 87.40M
- Beat/Miss
- Missed by -EUR 917.03K
- YoY Revenue Growth
- +62.01%
Earnings Announcement Details
- Quarter
- Q2 2026
- Date
- 08/05/2026
- Time
- After Close
- Conference Call
- Wednesday, August 5, 2026
OR Royalties's next earnings date is estimated for November 11, 2026, based on past reporting schedules.
Q2 2026 Earnings Call Audio
Q2 2026 Earnings Slide Deck
Q2 2026 Earnings Call Summary
The call highlighted materially strong financial performance (revenues +62%, operating cash flow +62%, high cash conversion margin), active accretive M&A and shareholder returns (dividend +18.2%, buybacks), and preserved 2026 guidance and 2030 outlook. Negative items were concentrated around the Canadian Malartic Barnat pit rock mass movement (affecting near-term GEOs), some logistics-driven deferrals, and a higher net debt position after recent acquisitions. Management emphasized that the Malartic event has limited long-term impact on ownership and reiterated focus on accretive growth and liquidity flexibility.
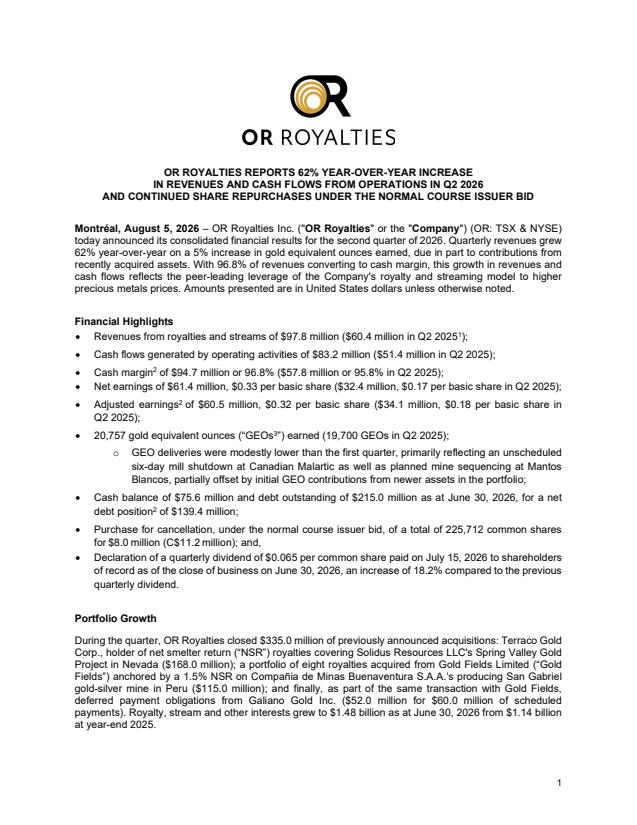
OR reiterated 2026 guidance of 80,000–90,000 gold equivalent ounces (GEOs) after reporting H1 deliveries of 43,497 GEOs (up 12% vs. H1 2025), but said the second half will be modestly lighter than the first following the Canadian Malartic Barnat wall movement: Agnico estimates ~370,000 ounces of gold inaccessible over the next three years (60–80k oz in H2 2026 and roughly 150k oz in each of 2027 and 2028), which OR applied at its 5% interest to imply ~3,500 fewer GEOs in 2026 and up to ~7,500 fewer GEOs in each of 2027 and 2028 (≈18,500 GEOs total over three years) — yet the company said its 2030 outlook of 120,000–135,000 GEOs is unchanged; management also noted Canadian Malartic set a quarterly record of 28,800 oz, shaft #1 sinking reached 1,586 m with first shaft production on schedule for Q2 2027, the portfolio now has 23 producing assets (24th, Cariboo’s Coiyu, commissioning in Q4), and the 2026 outlook excludes incremental GEOs from the newly closed Spring Valley and Murray Brook transactions.
- Strong Revenue and Cash Flow GrowthRevenues of $97.8M, up 62% YoY (from $60.4M). Cash flow from operations $83.2M, up 62% YoY. Growth achieved on a 5% increase in gold equivalent ounces (GEOs).
- Exceptional Cash Conversion MarginCash margin $94.7M representing 96.8% of revenues (up from 95.8% a year ago). Management highlighted $0.968 of every revenue dollar converted to cash margin, described as best in the sector.
- Earnings and Per-Share PerformanceNet earnings $61.4M or $0.33 per basic share (net earnings per share up 94% YoY). Adjusted earnings $60.5M or $0.32 per share (adjusted EPS up 78%). Cash flow per share $0.44 vs $0.27 a year ago (~63% increase).
- Maintained 2026 Guidance and Long-Term OutlookFirst-half deliveries 43,497 GEOs, up 12% vs H1 2025, and management maintained 2026 guidance of 80,000–90,000 GEOs. 2030 outlook of 120,000–135,000 GEOs stated as unaffected by recent events.
- Active, Accretive Capital DeploymentClosed Gold Fields royalty portfolio and Spring Valley acquisitions totaling $335M (funded largely from revolver). Subsequent closings include the Murray Brook stream (closed in July) and a $28M Murray Brook precious metals stream with $4M equity subscription.
- Improved Liquidity and Credit FlexibilityRevolver increased from $650M to $850M (≈+30.8%) and accordion expanded from $200M to $350M (+75%). Maturity extended from May 2029 to August 2030.
- Shareholder Returns and BuybacksQuarterly dividend raised 18.2% to $0.065 per share (47th consecutive quarterly dividend). Approx. $300M returned to shareholders to date via dividends. Repurchased ~1.6M shares YTD (~$37M across quarter and July).
- Portfolio Growth and New Production ContributorsPortfolio has 23 producing assets with a 24th (Cariboo Gold's Coiyu) commissioning expected in Q4. First royalty payment from Dalgaranga received; Namdini royalty (increased to 2%) ramping up as a significant contributor.
DE:OM40 Earnings History
| Report Date | Fiscal Quarter | Forecast / EPS | Last Year's EPS | EPS YoY Change | Press Release |
|---|---|---|---|---|---|
| Nov 11, 2026 | 2026 (Q3) | 0.25- | 0.2 | ― | ― |
| Aug 05, 2026 | 2026 (Q2) | 0.280.29 | 0.16 | 77.78% (+0.12) | |
| May 06, 2026 | 2026 (Q1) | 0.310.36 | 0.14 | 150.00% (+0.21) | |
| Feb 18, 2026 | 2025 (Q4) | 0.270.29 | 0.14 | 100.00% (+0.14) | |
| Nov 05, 2025 | 2025 (Q3) | 0.190.20 | 0.1 | 103.70% (+0.10) | |
| Aug 05, 2025 | 2025 (Q2) | 0.160.16 | 0.12 | 37.40% (+0.04) | |
| May 07, 2025 | 2025 (Q1) | 0.130.14 | 0.1 | 36.75% (+0.04) | |
| Feb 19, 2025 | 2024 (Q4) | 0.130.14 | 0.11 | 35.59% (+0.04) | |
| Nov 06, 2024 | 2024 (Q3) | 0.090.10 | 0.08 | 24.14% (+0.02) | |
| Aug 06, 2024 | 2024 (Q2) | 0.110.12 | 0.12 | -2.24% (-0.00) |
The table shows recent earnings report dates and whether the forecast was beat or missed. See the change in forecast and EPS from the previous year.