


Persimmon earnings date
Persimmon (OHP0) Q2 2026 Earnings Report
DE:OHP0 Q2 2026 EPS Results
- Actual EPS
- EUR 0.87
- Consensus EPS
- ―
- Beat/Miss
- ―
- One Year Ago EPS
- EUR 0.70
DE:OHP0 Q2 2026 Revenue Results
- Actual Revenue
- EUR 2.01B
- Expected Revenue
- ―
- Beat/Miss
- ―
- YoY Revenue Growth
- +19.22%
Earnings Announcement Details
- Quarter
- Q2 2026
- Date
- 08/06/2026
- Time
- Before Open
- Conference Call
- Thursday, August 6, 2026
Persimmon's next earnings date is estimated for March 3, 2027, based on past reporting schedules.
Q2 2026 Earnings Call Audio
Q2 2026 Earnings Slide Deck
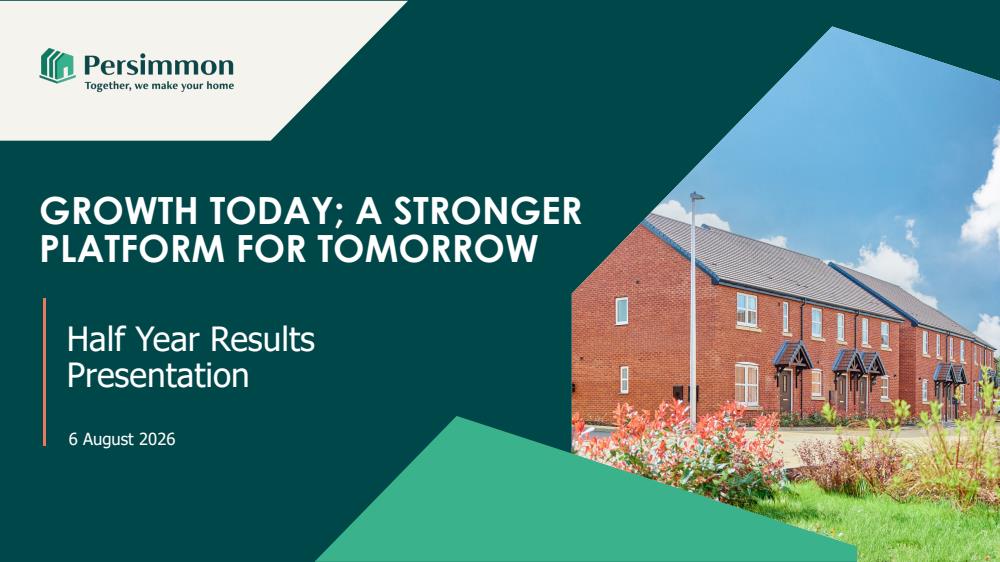
Q2 2026 Earnings Call Summary
The call presents a decidedly positive operational story: clear volume-led growth (completions +13%), higher operating profit (+10%) and stronger order book and land/pipeline positions. These positives are tempered by meaningful near-term margin headwinds from embedded build-cost inflation, incentives, remediation liabilities (GBP 206m) and a short-term sales softening. Management retains a strong balance sheet, medium-term targets (20% operating margin and improved ROCE) and active mitigation plans (self-help cost savings, vertical integration, new house types), and reiterates guidance for c.12,500 homes in 2026. Overall the positives around growth, cash/land position and strategic progress outweigh the near-term cost and execution risks.
Guidance reiterated that, assuming stable market conditions, Persimmon expects to deliver around 12,500 homes in FY26 (the top end of prior guidance) with underlying PBT broadly in line with consensus and year‑end net cash in line with previous guidance; adjusted gearing was 18% at 30 June (including land creditors) and could be around 20% at year‑end. Key H1 metrics underpinning that view include 5,189 completions (+13%), private completions 4,261 (+7%), average outlets 273, net private weekly sales 205 (+7%), a private sales rate (incl. bulk) of 0.75 (5‑week rate 0.72 incl. bulk, 0.59 excl.), a £1.9bn total forward order book (private book £1.3bn, up 5%, ~8% sold for the year; affordable order book £600m fully secured), underlying PBT £170m (+3%), underlying operating profit £189m (+10%) with a 12.8% operating margin, housing revenue ~£1.5bn, gross profit £267m (gross margin 18%), underlying EPS 38p (+3%), ROCE 11.3% (+10%), net debt £165m, PX stock £168m, £1bn committed bank facilities, owned/controlled land bank ~81,000 plots (strategic/promoter land ~93,000 plots), 6,123 detailed planning plots secured in H1 (118% of completions), and remediation items: closing provision £206m, H1 remediation spend £24m (total >£200m to date) with c.£100m planned this year; management also flags an embedded cost headwind of c.£40–50m over 18 months (half already identified to be mitigated) and reiterates medium‑term ambitions of a 20% operating margin and improved ROCE.
- Volume and Completions GrowthNew home completions rose 13% to 5,189 in H1 (and are up 22% over three years), driven by higher outlets and improved sales rates; average outlets were 273 (versus 272 last year).
- Revenue, Profit and Margin PerformanceHousing revenue approached GBP 1.5bn and gross profit was GBP 267m; underlying operating profit increased 10% to GBP 189m with an operating margin of 12.8%, and underlying PBT rose 3% to GBP 170m; underlying EPS increased 3% to 38p.
- Sales Momentum and First-Time Buyer StrengthNet private weekly sales increased 7% to 205 (sales rate including bulk 0.75); first-time buyers represented 36% of private sales (41% of open market sales) and first-time buyer sales grew 14% year-on-year, materially outperforming the market.
- Order Book, Pricing and ASPsForward order book stood at GBP 1.9bn (total book up 3% by value) with private forward orders up 5% to GBP 1.3bn; blended ASP on completions rose ~1% and private ASP rose ~3%; the private order book is ~8% sold for the year.
- Landbank, Planning and Outlet PipelineOwned and controlled landbank nearly 81,000 plots with strategic land holdings (including promoters) ~93,000 plots; secured detailed planning permission on 6,123 plots (118% of H1 completions, +21% year-on-year) and on track to open ~100 outlets this year.
- Balance Sheet, Cash Guidance and ReturnsAdjusted gearing (including land creditors) ~18%, net debt at 30 June GBP 165m with expected year-end net cash in line with guidance; return on capital increased ~10% to 11.3% and net assets rose (net assets per share improved).
- Operational and Product CapabilitiesAll three brands grew (Persimmon +7%, Charles Church +26%, Westbury +22%); vertical integration strengthened with Brickworks producing 31m bricks (+13%), Tileworks 5.6m tiles and Space4 timber frame products +30%; HBF 5-star maintained for fifth year and Trustpilot ratings at 4.6.
- Capital Allocation and Shareholder ReturnInterim dividend declared at 20p with an annual capital returns policy of at least 60p (currently dividends); board retains flexibility to deploy excess cash (growth investment and/or buybacks) as remediation spend declines.
DE:OHP0 Earnings History
| Report Date | Fiscal Quarter | Forecast / EPS | Last Year's EPS | EPS YoY Change | Press Release |
|---|---|---|---|---|---|
| Mar 03, 2027 | 2026 (Q4) | ―- | 1.34 | ― | ― |
| Aug 06, 2026 | 2026 (Q2) | ―0.87 | 0.7 | 23.92% (+0.17) | |
| Mar 10, 2026 | 2025 (Q4) | ―1.34 | 1.09 | 22.96% (+0.25) | |
| Aug 13, 2025 | 2025 (Q2) | ―0.70 | 0.76 | -7.53% (-0.06) | |
| Mar 11, 2025 | 2024 (Q4) | ―1.09 | 0.99 | 10.40% (+0.10) | |
| Aug 08, 2024 | 2024 (Q2) | ―0.76 | 0.73 | 3.42% (+0.03) | |
| Mar 12, 2024 | 2023 (Q4) | ―0.99 | 1.41 | -29.69% (-0.42) | |
| Aug 10, 2023 | 2023 (Q2) | ―0.73 | 2.38 | -69.28% (-1.65) | |
| Mar 01, 2023 | 2022 (Q4) | ―1.41 | 2.92 | -51.88% (-1.52) | |
| Aug 17, 2022 | 2022 (Q2) | ―2.38 | 2.94 | -18.97% (-0.56) |
The table shows recent earnings report dates and whether the forecast was beat or missed. See the change in forecast and EPS from the previous year.
