


Li Ning Company earnings date
Li Ning Company (LNLB) Q2 2025 Earnings Report
DE:LNLB Q2 2025 EPS Results
- Actual EPS
- EUR 0.08
- Consensus EPS
- EUR 0.07
- Beat/Miss
- Beat by +EUR 0.00
- One Year Ago EPS
- EUR 0.08
DE:LNLB Q2 2025 Revenue Results
- Actual Revenue
- EUR 1.85B
- Expected Revenue
- EUR 1.99B
- Beat/Miss
- Missed by -EUR 141.88M
- YoY Revenue Growth
- +2.38%
Earnings Announcement Details
- Quarter
- Q2 2025
- Date
- 08/21/2025
- Time
- Before Open
- Conference Call
- Thursday, August 21, 2025
Li Ning Company's next earnings date is estimated for March 18, 2027, based on past reporting schedules.
Q2 2025 Earnings Call Audio
Q2 2025 Earnings Slide Deck
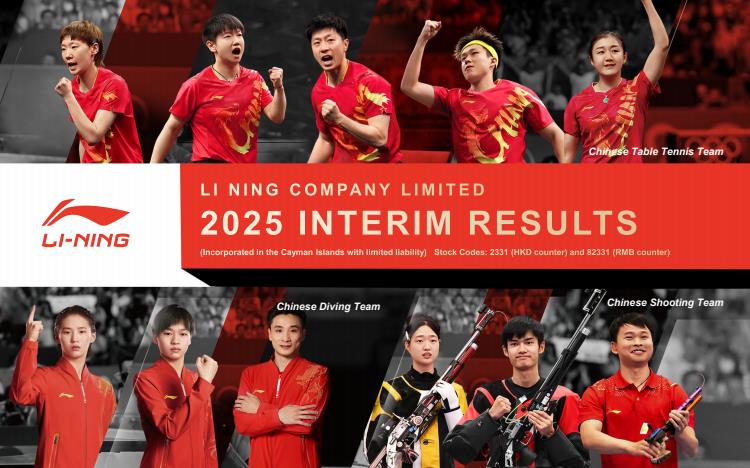
Q2 2025 Earnings Call Summary
The earnings call presented a mix of positive and negative aspects. The company showed growth in revenue and strong performance in the footwear and accessories segments, particularly in e-commerce and professional running shoes. However, challenges were evident in the apparel and basketball categories, with declining gross profit and net margins. The company's strategic partnerships and strong cash position are positive indicators for future growth.
During the call, Li Ning Company Limited provided several key financial and operational metrics for the first half of 2025. The company reported a revenue growth of 3.3%, reaching RMB 14.817 billion, with a net profit of RMB 1.737 billion and a net profit margin of 11.7%. The gross profit margin slightly decreased by 0.4 percentage points to 50%. The company maintained a healthy financial condition, with a net operating cash inflow of RMB 24.11 billion and an average working capital percentage of 7.3% relative to revenue. The Board of Directors proposed an interim dividend of RMB 0.3359 per share, maintaining a dividend payout ratio of 50%. Retail sales for the LI-NING main brand experienced low single-digit growth across all channels, while footwear revenue grew by 5% year-on-year, accounting for 56% of total revenue. In contrast, apparel revenue decreased by 3%, and accessories revenue increased by 24%, driven by the Badminton category, which grew by 38% and contributed 7% to the group's total revenue. Online sales outperformed offline sales, with e-commerce revenue rising by 1 percentage point to 31% of total revenue. The company also noted a slight decrease in direct retail revenue share to 23%, while wholesale revenue share increased by 1 percentage point to 46%. Despite a challenging market environment, Li Ning continued to focus on channel optimization and strategic investment in core product categories and brand development to drive long-term growth.
- Revenue GrowthRevenue grew by 3.3% to RMB 14.817 billion, and net operating cash inflow stood at RMB 24.11 billion.
- Footwear and Accessories GrowthFootwear revenue grew by 5% year-on-year, and accessories revenue increased by 24%, driven by the Badminton category.
- E-commerce PerformanceE-commerce revenue increased by 1 percentage point to 31% of total revenue, with retail sell-through achieving a high single-digit percentage increase.
- Professional Running Shoes SuccessProfessional running shoes sales exceeded 14 million pairs, with the core running shoes surpassing 5.26 million pairs.
- Strong Cash PositionNet cash increased by RMB 1.61 billion year-on-year to RMB 19.191 billion, ensuring strong support for future opportunities.
- Strategic PartnershipsSigned a contract to become the official partner of the Chinese Olympic Committee and the Chinese national sports delegation from 2025 to 2028.
DE:LNLB Earnings History
| Report Date | Fiscal Quarter | Forecast / EPS | Last Year's EPS | EPS YoY Change | Press Release |
|---|---|---|---|---|---|
| Mar 18, 2027 | 2026 (Q4) | 0.02- | 0.05 | ― | ― |
| Aug 20, 2026 | 2026 (Q2) | 0.070.08 | 0.08 | 4.51% (+0.00) | |
| Mar 19, 2026 | 2025 (Q4) | 0.050.05 | 0.05 | 12.13% (+0.01) | |
| Aug 21, 2025 | 2025 (Q2) | 0.070.08 | 0.08 | -10.93% (-0.01) | |
| Mar 27, 2025 | 2024 (Q4) | 0.050.05 | 0.05 | -0.29% (-0.00) | |
| Aug 15, 2024 | 2024 (Q2) | 0.080.08 | 0.09 | -6.04% (-0.01) | |
| Mar 19, 2024 | 2023 (Q4) | 0.060.05 | 0.08 | -42.93% (-0.03) | |
| Aug 10, 2023 | 2023 (Q2) | 0.090.09 | 0.09 | -3.22% (-0.00) | |
| Mar 17, 2023 | 2022 (Q4) | 0.080.08 | 0.09 | -10.00% (-0.01) | |
| Aug 11, 2022 | 2022 (Q2) | 0.710.11 | 0.11 | 6.41% (+0.01) |
The table shows recent earnings report dates and whether the forecast was beat or missed. See the change in forecast and EPS from the previous year.
