


Kilroy Realty earnings date
Kilroy Realty (KRC) Q3 2026 Earnings Report
DE:KRC Q3 2026 EPS Results
- Actual EPS
- EUR 0.12
- Consensus EPS
- EUR 0.11
- Beat/Miss
- Beat by +EUR 0.00
- One Year Ago EPS
- EUR 1.17
DE:KRC Q3 2026 Revenue Results
- Actual Revenue
- EUR 241.62M
- Expected Revenue
- EUR 238.43M
- Beat/Miss
- Beat by +EUR 3.19M
- YoY Revenue Growth
- -2.91%
Earnings Announcement Details
- Quarter
- Q3 2026
- Date
- 10/22/2026
- Time
- After Close
- Conference Call
- Thursday, October 22, 2026
Kilroy Realty's next earnings date is estimated for February 1, 2027, based on past reporting schedules.
Q3 2026 Earnings Call Audio
Q3 2026 Earnings Slide Deck
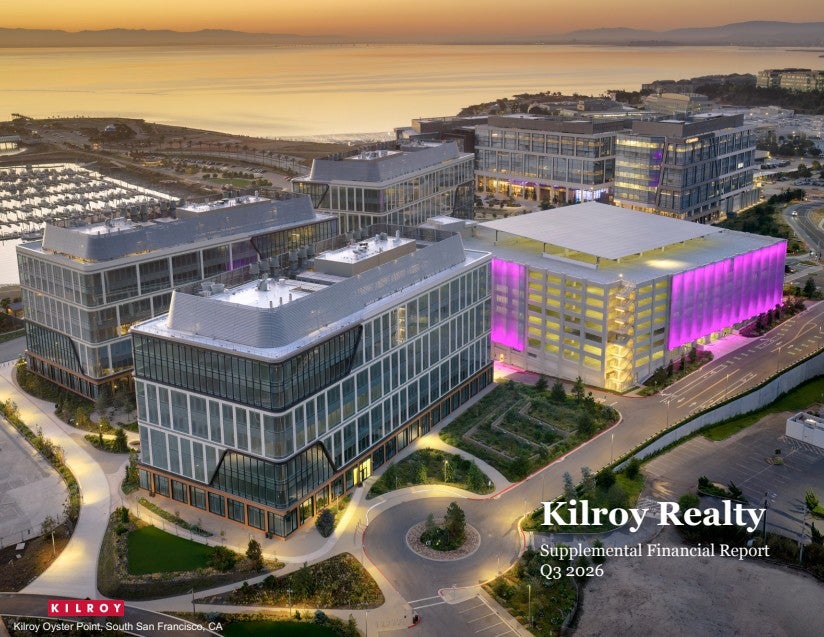
Q3 2026 Earnings Call Summary
The call was strongly positive overall. Management reported substantial leasing volume, materially improved re-leasing spreads, broad-based demand growth, an expanding signed and forward pipeline, improved leased occupancy and higher FFO guidance. These strengths were partially offset by lower total occupancy, negative cash same-property NOI growth, upcoming debt maturities with potentially higher financing costs, expected DIRECTV vacancy, uneven conditions in portions of Los Angeles and Austin, and the substantial expense impact from stopping Flower Mart capitalization.
Management revised FFO guidance to be between $3.55 and $3.59, with a midpoint of $3.57, up $0.01 from the prior estimate; the revised range of positive 0.75% to 1.00% for same-property NOI is up 12.5 basis points at the midpoint, while the midpoint implies fourth quarter FFO of $0.86 per share. The outlook includes $48 million in SNO ABR anticipated to commence between the end of Q3 and year-end 2027, including $14 million expected to come online in the fourth quarter of 2026 and $34 million anticipated to take effect in 2027; late 2026 and 2027 debt maturities total approximately $395 million at a weighted average effective interest rate of 3.8%, with every 100 basis point increase above 3.8% having an annualized impact of roughly $4 million. DIRECTV’s remaining 484,000 square feet expires at the beginning of the fourth quarter of 2027, with annual ABR for both tranches of $16 million or roughly $4 million per quarter, and stopping capitalization of Flower Mart, now expected in January 2027, has an annualized impact of roughly $32 million in additional interest expense and $5 million in additional operating expenses and taxes for a total of $37 million.
- Strong Quarterly and Year-to-Date Leasing VolumeThe company executed approximately 815,000 square feet of new and renewal leases in the third quarter, substantially all of which were long term. Year-to-date leasing volume exceeded 1.75 million square feet, an increase of nearly 44% versus the first nine months of 2025. All five regions reported sequential leased-occupancy improvements of more than 100 basis points, across 45 transactions.
- Significantly Improved Re-Leasing SpreadsFor comparable leases signed during the quarter, GAAP rental rates increased 30.6% and cash rents increased 9.7%. Excluding leases on spaces vacant for more than 12 months, re-leasing spreads improved to 37.9% on a GAAP basis and 14.9% on a cash basis. Year-to-date annualized capital per square foot for second-generation deals was down 2.4% versus the same period in 2025 despite re-leasing spreads improving by roughly 2,000 basis points.
- Expanded Signed but Not Yet Commenced PipelineThe signed but not yet commenced pool increased to more than 1.4 million square feet and approximately $101 million of contractually obligated annualized base rent. ABR per square foot was nearly $72, approximately 22% above the current portfolio-wide average, and 78% of the pool consisted of triple-net leases versus 54% of the existing portfolio. The spread between build and leased occupancy stood at 610 basis points.
- Growing Forward Leasing PipelineThe total square footage represented by pipeline transactions increased 20% quarter-over-quarter. Management said the pipeline expansion was broadly distributed across the regions, with the majority consisting of new-deal activity and additional early-renewal discussions. Only just over 6% of total portfolio ABR expires between the call date and the end of 2027.
- Strong San Francisco Leasing ActivityThe San Francisco Bay Area led the company in executed deal volume and forward pipeline activity. The company signed a 12-year, 243,000-square-foot renewal with Box at Crossing 900 in downtown Redwood City at what management described as highly compelling lease economics. Demand from technology, AI and robotics companies continued to accelerate, while premium large-block space was described as increasingly scarce.
- Broad-Based Regional Leasing ProgressSeattle had the largest sequential leased-occupancy increase at 220 basis points. In San Diego, the company signed four new leases at Kilroy Centre Del Mar totaling approximately 70,000 square feet, with blended re-leasing spreads of 38% on a GAAP basis and 12% on a cash basis, while One Paseo remained over 99% leased. Indeed Tower in Austin became more than 90% leased following a new media-company lease.
- Life Science Leasing MomentumThe company signed a 49,000-square-foot full-building lease with a life science company at 4400 Bohannon after multiple parties competed for the space. At Kilroy Oyster Point Phase 2, management reported ongoing active negotiations for all remaining multi-tenant vacancy and a growing list of larger potential users for the full-building opportunity.
- Positive AI, Robotics and Office Demand TrendsManagement cited approximately 500,000 square feet of AI- and robotics-related demand in San Francisco, including robotics, battery and related R&D users. There were 31 San Francisco requirements exceeding 100,000 square feet, of which 21 were AI companies and institutional-quality users. San Francisco asking rents were up 7% from the prior quarter, and office utilization was described as improving across the portfolio.
- Improved Los Angeles Activity in Select SubmarketsAlthough the Los Angeles recovery remained nuanced and submarket dependent, Century City vacancy was reported at 15% and trophy-quality vacancy at 9%. Culver City recorded almost 129,000 to 130,000 square feet of positive absorption during the quarter, and the company signed two new leases with well-capitalized technology and fintech tenants at Blackwelder.
- Higher Lease Percentage and Lower Near-Term RolloverPortfolio occupancy including KOP 2 ended at 76.9%, while leased occupancy increased 150 basis points from the prior quarter to 83.0%. Lease rollover through year-end 2028 declined by nearly 300 basis points.
- Raised Full-Year FFO GuidanceThe company revised its FFO guidance range to $3.55 to $3.59 per diluted share, with a midpoint of $3.57, up $0.01 from the prior estimate. The revised same-property NOI growth range was positive 0.75% to 1.00%, up 12.5 basis points at the midpoint. The guidance increase included $0.01 from same-property NOI, $0.02 from higher development NOI and $0.01 from lower net interest expense.
- Balance Sheet Flexibility and Debt RepaymentThe company repaid $200 million of private-placement notes with cash on hand in July. It reported more than $1.2 billion of unused capacity between its line of credit and term loan to address upcoming maturities while evaluating more permanent financing options.
- Progress on Flower Mart Entitlement ProcessThe Flower Mart project received constructive and supportive feedback at an informational meeting with the San Francisco Planning Commission. Management currently expects the amendment process with the city to conclude at the end of January 2027, after which capitalization will cease. The process is intended to provide greater flexibility to develop the site in discrete phases in response to tenant demand.
- Land Monetization ProgressThe company announced the pending sale of its East Village land site in downtown San Diego to a residential developer for $19.5 million. This was the fourth land sale under contract, bringing total transaction proceeds under contract to $185 million. Management said it will continue exploring monetization of additional noncore land sites and operating-portfolio properties.
- Lower Year-to-Date Tenant Improvement and Leasing CostsAlthough quarterly tenant improvements and leasing commissions were $94 per square foot, management said annualized TI and LC per square foot for year-to-date activity was down almost 2.5% versus the same period in 2025, even as re-leasing spreads were materially better.
DE:KRC Earnings History
| Report Date | Fiscal Quarter | Forecast / EPS | Last Year's EPS | EPS YoY Change | Press Release |
|---|---|---|---|---|---|
| Feb 01, 2027 | 2026 (Q4) | 0.11- | 0.09 | ― | ― |
| Oct 22, 2026 | 2026 (Q3) | 0.110.12 | 1.17 | -90.08% (-1.05) | |
| Jul 27, 2026 | 2026 (Q2) | 0.130.15 | 0.51 | -70.18% (-0.36) | |
| Apr 27, 2026 | 2026 (Q1) | 0.13-0.14 | 0.29 | -148.48% (-0.44) | |
| Feb 09, 2026 | 2025 (Q4) | 0.260.09 | 0.44 | -80.00% (-0.36) | |
| Oct 27, 2025 | 2025 (Q3) | 0.271.17 | 0.39 | 197.73% (+0.77) | |
| Jul 28, 2025 | 2025 (Q2) | 0.280.51 | 0.36 | 39.02% (+0.14) | |
| May 05, 2025 | 2025 (Q1) | 0.280.29 | 0.37 | -21.43% (-0.08) | |
| Feb 10, 2025 | 2024 (Q4) | 0.290.44 | 0.36 | 25.00% (+0.09) | |
| Oct 28, 2024 | 2024 (Q3) | 0.320.39 | 0.4 | -2.22% (-0.01) |
The table shows recent earnings report dates and whether the forecast was beat or missed. See the change in forecast and EPS from the previous year.
