

Intercontinental Exchange (IC2) Q3 2026 Earnings Report
DE:IC2 Q3 2026 EPS Results
- Actual EPS
- EUR 1.81
- Consensus EPS
- EUR 1.77
- Beat/Miss
- Beat by +EUR 0.04
- One Year Ago EPS
- EUR 1.53
DE:IC2 Q3 2026 Revenue Results
- Actual Revenue
- EUR 3.00B
- Expected Revenue
- EUR 2.46B
- Beat/Miss
- Beat by +EUR 539.80M
- YoY Revenue Growth
- +11.31%
Earnings Announcement Details
- Quarter
- Q3 2026
- Date
- 10/29/2026
- Time
- Before Open
- Conference Call
- Thursday, October 29, 2026
Intercontinental Exchange's next earnings date is estimated for February 11, 2027, based on past reporting schedules.
Q3 2026 Earnings Call Audio
Q3 2026 Earnings Slide Deck
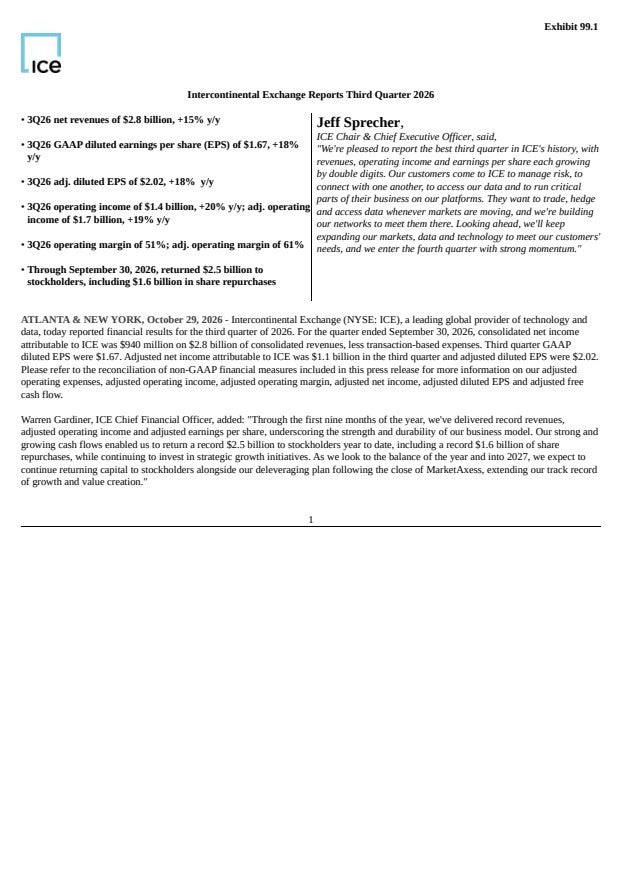
Q3 2026 Earnings Call Summary
The call was strongly positive, supported by record third-quarter and nine-month financial results, broad-based growth across exchanges and data businesses, higher recurring-revenue expectations, record trading activity, strong shareholder returns, and progress on strategic initiatives. The main challenges were higher full-year expense and capital expenditure expectations, expected fourth-quarter Mortgage Technology transaction revenue declines, elevated mortgage rates, energy-market disruptions, and regulatory or early-stage uncertainty around several new initiatives. Highlights significantly outweighed lowlights.
ICE expects fourth quarter adjusted operating expenses to be in the range of $1,082,000,000 to $1,092,000,000, fourth quarter adjusted non-operating expense to be between $175 million and $185 million, and the adjusted tax rate to be towards the high end of our 24%-26% range; full-year CapEx is expected to be approximately $1,050,000,000, full-year exchange recurring revenue growth approximately 9%, the upper end of the high single-digit range discussed in July, fourth quarter OTC and other revenues around $100 million, and full-year FIDS recurring revenue growth approximately 8%, the top of the prior range. Mortgage Technology recurring revenues are expected to grow modestly from the third quarter, while transaction revenues are expected to decline from both the third quarter and the prior year; ICE expects to exit 2026 with approximately $270 million of annualized expense synergies, compared with an original five-year target of $200 million, and expects the MarketAxess transaction to close in the first quarter of 2027.
- Record Third-Quarter Financial PerformanceThird-quarter adjusted earnings per share were $2.02, up 18% year-over-year, representing ICE's best third quarter in its history and second-best quarter ever. Net revenues were $2.8 billion, up 15%, adjusted operating income increased 19% to $1.7 billion, recurring revenues reached a record $1.4 billion, up 7%, and transaction revenues grew 23%.
- Strong Nine-Month Results and Operating LeverageThrough nine months, adjusted earnings per share were $6.27, up 20% year-over-year, while revenue growth was 12%. ICE expanded margins, accelerated investment, and delivered record year-to-date performance.
- Record Free Cash Flow and Shareholder ReturnsAdjusted free cash flow was $1.1 billion in the third quarter and a record $3.7 billion year-to-date, up 17%. ICE repurchased $400 million of stock and paid $293 million in dividends during the quarter, returning $693 million to shareholders. Year-to-date shareholder returns totaled $2.5 billion, more than 40% above the same period last year and a record for ICE.
- MarketAxess Financing and Earlier Expected ClosingICE completed financing for MarketAxess by issuing $3.75 billion of senior notes, alongside a $2 billion term loan and commercial paper capacity. The Department of Justice approved the transaction, and ICE now expects it to close in the first quarter of 2027, ahead of the first-half timeline previously outlined. Excluding the pre-funded MarketAxess notes, leverage ended the quarter at 2.65 times, down from 2.8x in June and just over 2.9x a year ago.
- Record Exchanges Revenue Across Asset ClassesExchanges net revenue was $1.5 billion, up 22%, a third-quarter record and nearly 40% above the level of three years ago. Transaction revenues rose 28%, with energy up 26%, interest rates up 48%, and agricultural and metal up 62%.
- NYSE Trading Growth and Open InterestNYSE cash equities and equity options net revenue grew 25% to $132 million, a third-quarter record. Total open interest ended the quarter up 13% year-over-year, providing a strong foundation entering the fourth quarter and 2027.
- Record Exchange Recurring Revenue and Higher GuidanceExchange recurring revenues reached a record $422 million, up 8%, led by record Exchange Data Services revenue of $292 million, up 10%. ICE raised its expectation for full-year exchange recurring revenue growth to approximately 9%, the upper end of the high single-digit range discussed in July.
- NYSE Listings and Transfers Remained StrongDespite slower industry IPO activity in the third quarter, the NYSE listed the quarter's only two IPOs to raise more than $1 billion, Csquare and Jersey Mike's. Year-to-date, it facilitated $26.5 billion in IPO proceeds across 73 IPOs, surpassing all of 2025 and marking its strongest year since 2021. Nine companies representing nearly half a trillion dollars in market capitalization transferred to the NYSE, the largest annual total on record, while the retention rate remained above 99%.
- Record Fixed Income and Data Services ResultsFixed Income and Data Services revenue reached a record $674 million, up 9% year-over-year, while recurring revenue was a record $538 million, also up 9%. Fixed Income Data and Analytics grew 8% to $336 million, Pricing and Reference Data grew 7%, the index business grew 24%, and data network technology revenue increased 10% to a record $202 million.
- Higher Fixed Income and Data Services GuidanceFixed Income and Data Services recurring revenue growth was slightly ahead of the trajectory outlined in July, driven by stronger consumption trends, net new sales, and growth in index assets. ICE now expects full-year FIDS recurring revenue growth of approximately 8%, the top of its prior range.
- Record CDS Clearing PerformanceTransaction revenues in Fixed Income and Data Services grew 11%, led by a record third quarter in CDS clearing. CDS clearing revenue rose 13% to $102 million, and ICE Clear Credit cleared $2.7 trillion of notional in a single day during the September index roll.
- Mortgage Technology Integration and Synergy ProgressMortgage Technology revenue was $549 million, up 4%, with servicing and data and analytics each growing 6%. Recurring revenue was $405 million, up 4%. The Black Knight integration continues to deliver ahead of plan, and ICE now expects to exit 2026 with approximately $270 million of annualized expense synergies versus the original five-year target of $200 million.
- Record Trading Volumes and Open InterestFutures and options average daily volume increased 31%, a record for any third quarter and ICE's second-highest quarter ever. Total open interest ended the quarter up 13%, and fourth-quarter volume was up 13% quarter-to-date.
- Strong Energy Market ActivityThird-quarter TTF volume increased 39% year-over-year, TTF options volume rose 72%, JKM volume increased 45%, and Brent volume was up 38%. Energy open interest ended the quarter at 66 million lots, options open interest was up 14%, and options represented 40% of energy open interest. North American financial gas volume increased 15%, with open interest reaching a record 13.4 million lots on July 1.
- Strong Interest Rate and Financials Franchise GrowthInterest rate volume increased 49% in the quarter, with EURIBOR up 40% and SONIA up 63%. In September, total rate volume was up 95%, EURIBOR was up 84%, and SONIA was up 119%. Interest rate open interest finished the quarter up 30%, EURIBOR futures open interest reached a record 6 million lots, and SONIA open interest was up 48%.
- Agricultural Market GrowthAgricultural market volumes increased 57% and open interest increased 43%. Sugar open interest reached a record 2.5 million lots on September 11.
- Growth in Index Assets and Private Credit InfrastructureETF assets benchmarked to ICE indices reached a record $935 billion, up 24%. ICE also launched ICE IDs in July with Apollo as its anchor partner and added a private-credit reference data service in September.
- Expansion of Data Center, AI, and Connectivity OfferingsICE has doubled global co-location capacity since 2020 and expects its new data center to double it again. The company is developing compute futures through the Ornn Index and NATIVX COIL Index, is delivering data through an open-standard Model Context Protocol, and reported that data subscriptions were up 70% over five years, including increases of 16% year-over-year in oil and roughly 12% in gas.
- Mortgage Network Adoption and AI EnablementICE's mortgage servicing business processed 11.6 billion API and web services calls during the quarter, up 36%. Wells Fargo renewed its MSP agreement and is moving its home equity portfolio onto MSP, Freedom Mortgage signed onto MSP for its HELOC portfolio, and ICE reached five new MSP clients year-to-date. ICE also stated that roughly half of U.S. loans are on Encompass and MSP and 85% are on MERS.
- New Products and Digital Asset Market InitiativesICE received regulatory approvals for Binary Return Derivatives and binary options tied to key performance indicators, introduced economic indicator futures, and plans to launch 23x5 equity trading in December. ICE also announced partnerships and investments involving Trade[XYZ], Hyperliquid, OKX, Polymarket, and tokenized securities, subject to applicable regulatory approvals.
DE:IC2 Earnings History
| Report Date | Fiscal Quarter | Forecast / EPS | Last Year's EPS | EPS YoY Change | Press Release |
|---|---|---|---|---|---|
| Feb 11, 2027 | 2026 (Q4) | 1.73- | 1.53 | ― | ― |
| Oct 29, 2026 | 2026 (Q3) | 1.771.81 | 1.53 | 18.13% (+0.28) | |
| Jul 30, 2026 | 2026 (Q2) | 1.641.70 | 1.62 | 4.97% (+0.08) | |
| Apr 30, 2026 | 2026 (Q1) | 2.002.10 | 1.54 | 36.63% (+0.56) | |
| Feb 05, 2026 | 2025 (Q4) | 1.501.53 | 1.36 | 12.50% (+0.17) | |
| Oct 30, 2025 | 2025 (Q3) | 1.431.53 | 1.39 | 10.32% (+0.14) | |
| Jul 31, 2025 | 2025 (Q2) | 1.581.62 | 1.36 | 19.08% (+0.26) | |
| May 01, 2025 | 2025 (Q1) | 1.531.54 | 1.33 | 16.22% (+0.21) | |
| Feb 06, 2025 | 2024 (Q4) | 1.341.36 | 1.19 | 14.29% (+0.17) | |
| Oct 31, 2024 | 2024 (Q3) | 1.391.39 | 1.31 | 6.16% (+0.08) |
The table shows recent earnings report dates and whether the forecast was beat or missed. See the change in forecast and EPS from the previous year.
