


Compagnie de Saint-Gobain SA earnings date
Compagnie de Saint-Gobain SA (GOBU) Q2 2026 Earnings Report
DE:GOBU Q2 2026 EPS Results
- Actual EPS
- EUR 0.36
- Consensus EPS
- EUR 0.32
- Beat/Miss
- Beat by +EUR 0.03
- One Year Ago EPS
- EUR 0.38
DE:GOBU Q2 2026 Revenue Results
- Actual Revenue
- EUR 24.88B
- Expected Revenue
- EUR 12.63B
- Beat/Miss
- Beat by +EUR 12.25B
- YoY Revenue Growth
- +5.65%
Earnings Announcement Details
- Quarter
- Q2 2026
- Date
- 07/30/2026
- Time
- After Close
- Conference Call
- Thursday, July 30, 2026
Compagnie de Saint-Gobain SA's next earnings date is estimated for February 18, 2027, based on past reporting schedules.
Q2 2026 Earnings Call Audio
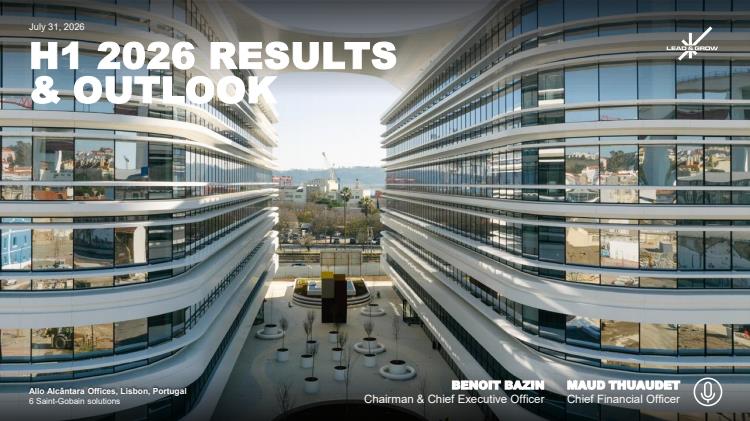
Q2 2026 Earnings Slide Deck
Q2 2026 Earnings Call Summary
The call presents a predominantly positive operational and strategic picture: solid Q2 acceleration, strong EBITDA margin (15.4%), robust free cash flow (EUR 2.1bn) and active, accretive portfolio rotation (~EUR 3bn YTD). Key growth engines—construction chemicals and Asia Pacific—delivered strong outperformance and management reiterated >15% EBITDA target for 2026. Headwinds include H1 negative price-cost spread, FX dilution (-1.3%), a modest EPS decline (-2.6%), and ongoing inflation/geo‑political uncertainty. On balance the positive financial performance, cash generation, strategic M&A and execution of the Lead & Grow plan outweigh the challenges.
Management reiterated a 2026 outlook combining continued like‑for‑like growth across regions with disciplined margin and cash targets: they expect a slight positive price‑cost spread for the year, an EBITDA margin above 15% (H1 15.4%), and H2 like‑for‑like sales growth after H1 +0.7% (Q2 +3.5%; Asia‑Pacific H1 +7.0% like‑for‑like, Europe H1 +1.7%, North America Q2 +1.2%); construction chemicals remain a key growth engine (Q2 organic +8.5%, target ~€9bn sales by 2030). Key financial metrics: recurring net income €1.7bn (H1), free cash flow €2.1bn (H1) with 65% cash conversion on EBITDA (125% on recurring NI), operating working capital 24 days, CapEx ~€2bn FY, net debt ratio 1.6x, H1 ROCE 13.5% (target >13% over the plan), EPS down 2.6% in local currencies, tax rate ~25%, depreciation +3%, and non‑operating costs expected slightly below €250m p.a. Operational and portfolio actions: prices +0.8% H1 (up 1.6% in Q2; realized pricing noted ≈1.8%), FX headwind −1.3% H1, structure −0.5% H1, energy <4% of sales and ~75% hedged for 2026, ~90% of CapEx/M&A deployed in high‑growth markets, and 23 transactions YTD rotating ~€3bn of sales (≈40–50bp margin accretion on a full‑year basis and roughly one‑third of the >20% sales‑rotation target to 2030); overall guidance emphasizes outperformance, margin, cash and disciplined capital allocation.
- Organic Sales Growth (H1 and Q2)Like-for-like sales growth +0.7% in H1 2026 and +3.5% in Q2 2026, with all regions growing in Q2 (Asia Pacific +7% LFL in H1, Europe Q2 +4%, North America Q2 +1.2%).
- Strong Profitability MetricsEBITDA margin of 15.4% in H1 2026 and management guidance of >15% for 2026 full year; regional EBITDA margins include Americas 19.5% and Asia Pacific record 18.5%.
- Robust Recurring Profit and Cash GenerationRecurring net income ~EUR 1.7 billion in H1; free cash flow EUR 2.1 billion with cash conversion of 65% on EBITDA and 125% on recurring net income; operating working capital stable at 24 days.
- Active Portfolio Rotation and M&A Execution23 acquisitions/divestments signed or closed in H1; ~EUR 3 billion of sales rotated year-to-date (≈1/3 of the >20% sales rotation target by 2030).
- Construction Chemicals OutperformanceConstruction chemicals strongly outperformed with +8.5% organic sales growth in Q2 and continued double-digit growth in key markets (India, North America construction chemicals momentum).
- Investment in Growth Capabilities and Footprint13 of 14 new lines/plants opened in H1 across North America, Asia and emerging markets; ~90% of gross CapEx and M&A invested in high-growth regions; CapEx expected ~EUR 2 billion for 2026.
- Balance Sheet Strength and Shareholder ReturnsNet debt ratio 1.6x; EUR 1.4 billion returned to shareholders in H1 including EUR 292 million share buybacks, reflecting disciplined capital allocation.
- Regional Outperformance — Asia PacificAsia Pacific growth 8.4% in local currencies and 7% LFL in H1, broad-based across India, Southeast Asia, China and Australia; region delivered a record EBITDA margin of 18.5%.
- Pricing Realization and Energy HedgingPrices up 0.8% in H1 and up 1.6% in Q2 (management later cites ~1.8% in Q2 pricing momentum); energy bill <4% of group sales with ~75% of 2026 energy exposure hedged.
- Operational & Strategic Execution — Lead & GrowManagement highlights strong execution of the Lead & Grow plan: solution rollouts, cross-selling (example: Eastern Europe cross-selling ≈+1% growth contribution), AI deployment, and targeted acquisitions (Xypex, AGC Polymer Materials).
DE:GOBU Earnings History
| Report Date | Fiscal Quarter | Forecast / EPS | Last Year's EPS | EPS YoY Change | Press Release |
|---|---|---|---|---|---|
| Feb 18, 2027 | 2026 (Q4) | 0.29- | 0.33 | ― | ― |
| Jul 30, 2026 | 2026 (Q2) | 0.320.36 | 0.38 | -5.49% (-0.02) | |
| Feb 26, 2026 | 2025 (Q4) | 0.310.33 | 0.47 | -29.84% (-0.14) | |
| Jul 31, 2025 | 2025 (Q2) | 0.380.38 | 0.33 | 13.55% (+0.05) | |
| Feb 27, 2025 | 2024 (Q4) | ―0.23 | 0.28 | -18.10% (-0.05) | |
| Jul 26, 2024 | 2024 (Q2) | ―0.33 | 0.35 | -5.87% (-0.02) | |
| Feb 29, 2024 | 2023 (Q4) | 0.290.28 | 0.28 | 0.64% (+0.00) | |
| Jul 26, 2023 | 2023 (Q2) | ―0.35 | 0.32 | 10.11% (+0.03) | |
| Feb 23, 2023 | 2022 (Q4) | 0.290.28 | 0.25 | 12.19% (+0.03) | |
| Jul 27, 2022 | 2022 (Q2) | 0.620.32 | 0.31 | 5.33% (+0.02) |
The table shows recent earnings report dates and whether the forecast was beat or missed. See the change in forecast and EPS from the previous year.
