

First Industrial Realty (F5W) Q3 2026 Earnings Report
DE:F5W Q3 2026 EPS Results
- Actual EPS
- EUR 0.39
- Consensus EPS
- EUR 0.42
- Beat/Miss
- Missed by -EUR 0.02
- One Year Ago EPS
- EUR 0.44
DE:F5W Q3 2026 Revenue Results
- Actual Revenue
- EUR 176.24M
- Expected Revenue
- EUR 175.61M
- Beat/Miss
- Beat by +EUR 633.03K
- YoY Revenue Growth
- +8.65%
Earnings Announcement Details
- Quarter
- Q3 2026
- Date
- 10/21/2026
- Time
- After Close
- Conference Call
- Wednesday, October 21, 2026
First Industrial Realty's next earnings date is estimated for February 10, 2027, based on past reporting schedules.
Q3 2026 Earnings Call Audio
Q3 2026 Earnings Slide Deck
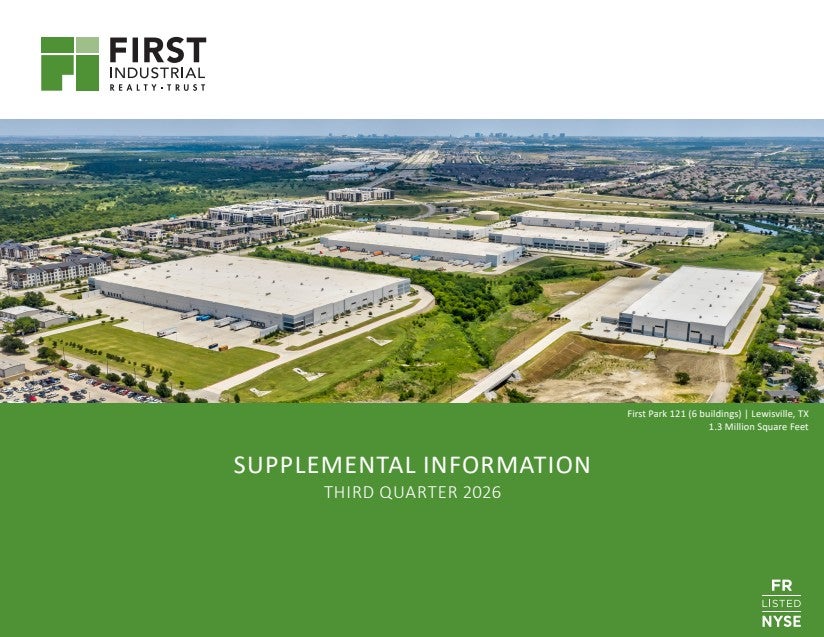
Q3 2026 Earnings Call Summary
The call was predominantly positive. The company reported higher FFO, strong same-store NOI growth, occupancy above prior expectations, substantial leasing spreads, improved industrial market fundamentals, completed acquisitions, and continued development and data center opportunities. The principal challenges were the shift of approximately 150,000 square feet of development leasing into 2027, expected moderation in future rent growth, remaining leasing needs in select markets, higher fuel and construction costs, swap-rate exposure, and proxy campaign costs. Highlights significantly outweighed the lowlights.
For 2026, NAREIT FFO guidance is $3.11 to $3.15 per share, including $0.04 per share of advisory costs related to the contested proxy campaign, or $3.15 to $3.19 per share excluding these advisory costs; end of fourth quarter in-service occupancy is expected at 94.5% to 96.5% with a midpoint of 95.5%, implying an average quarter end in-service occupancy for the year of 94.5% to 95%, with approximately 650,000 square feet of incremental development leasing assumed to occur at the end of December; fourth quarter cash same-store NOI growth before termination fees is expected at 4% to 6%, implying full year 2026 cash same-store NOI growth before termination fees of 6.25% to 6.75%, an increase of 75 basis points at the midpoint; the company expects to capitalize about $0.08 per share of interest, and G&A expense guidance remains $42 million to $43 million, excluding $5.6 million of costs related to the contested proxy campaign. For 2027, retention is expected to be 65% to 75%, and management said the full year number for cash rent increases is not expected to be meaningfully different from the 16% achieved thus far.
- Solid Quarterly Financial PerformanceThird-quarter NAREIT funds from operations were $0.81 per fully diluted share versus $0.76 a year ago. Cash same-store NOI growth, excluding termination fees, was 5.6%, primarily driven by increases in rental rates on new and renewal leasing and contractual rent bumps.
- Raised 2026 FFO and Same-Store NOI GuidanceThe company increased its 2026 NAREIT FFO guidance midpoint by $0.01 per share and narrowed the range to $3.11 to $3.15 per share. Excluding $0.04 per share of advisory costs related to the contested proxy campaign, guidance is $3.15 to $3.19 per share. Full-year 2026 cash same-store NOI growth guidance before termination fees increased by 75 basis points at the midpoint to 6.25% to 6.75%.
- Occupancy Beat Prior ForecastIn-service occupancy ended the quarter at 94.1%, exceeding the 93.5% forecast communicated on the second-quarter call, due to incremental leasing in the in-service portfolio. Fourth-quarter ending occupancy guidance remains 94.5% to 96.5%, with a midpoint of 95.5%.
- Strong 2026 Leasing Spreads and Rollover ProgressThe company has addressed 94% of its 2026 lease expirations by square footage, with an overall cash rental rate increase of 38% for new and renewal leasing.
- Meaningful Early Progress on 2027 RenewalsRenewals representing 45% of all leases expiring in 2027 have been signed so far, with a 16% cash rent increase. Excluding Southern California expirations, the cash rent increase is north of 20%. Approximately half of the signed Southern California renewals have been completed, and management said it does not expect the full-year 2027 spread to be meaningfully different from the year-to-date result.
- Industrial Market Fundamentals ImprovedNational industrial vacancy declined 10 basis points to 6.3% in the third quarter. Net absorption was 105 million square feet, exceeding completions of 79 million square feet and reaching its highest quarterly level since the fourth quarter of 2022. Year-to-date net absorption was 238 million square feet versus 183 million square feet of completions.
- High-Quality Acquisition in Central PennsylvaniaThe company acquired Park 83 Logistics Center, a 764,000-square-foot, 2023-vintage cross-dock facility in Central Pennsylvania. The building is 100% leased to a Fortune 500 tenant, was purchased for $120 million, and carries an in-place cash yield of 5.1% and a yield of 5.8% using current market rents. Management expects the yield to be closer to 6.5% when the project is available to go to market.
- Expanded Development Land Bank in DallasThe company acquired a 32-acre infill site in McKinney, Northeast Dallas, for $13 million. The site can accommodate two buildings totaling 390,000 square feet, including a 233,000-square-foot first phase that is near-term developable upon entitlement and completion of infrastructure work. The targeted cash yield for Phase 1 is in the mid-6% area.
- Development Leasing GrowthThe company signed a 32,000-square-foot lease at First Park Miami Building 12, bringing total development leases signed during the year to 849,000 square feet.
- Broad Leasing Activity Across Southern CaliforniaDuring the third quarter and fourth quarter to date, the company leased three in-service vacancies on a long-term basis: a 188,000-square-foot facility and a 78,000-square-foot facility in Inland Empire East, plus a transload facility in Los Angeles. Management also reported healthy activity for two additional approximately 200,000-square-foot Inland Empire East facilities.
- Significant Quarterly Leasing VolumeApproximately 2.3 million square feet of leases commenced in the third quarter, including 400,000 square feet of new leases, 1.6 million square feet of renewals, and 300,000 square feet related to developments and acquisitions with lease-up.
- Stable Lease EscalationsThe company reported 3.5% escalations on 2026 signings so far, compared with approximately 3.6% in the past couple of years. Escalations across the entire portfolio were 3.4%, and management said they have been holding steady.
- Pipeline of Potential Development StartsManagement identified potential near-term development opportunities in South Florida, Dallas, Northern California, Central Pennsylvania, and Chicago. The company said it has plenty of opportunity to earn strong development yields and IRRs and does not see a limit to its ability to invest in new development at acceptable yields.
- Additional Data Center Value-Creation OpportunitiesThe company is pursuing a handful of opportunities involving land and cash-flowing buildings for potential sales to data center developers, including pursuing power for several sites. Management said the value-creation opportunity is substantial, with current efforts focused more on the East Coast.
- Limited Concern About Political and Local Regulatory DevelopmentsManagement said it is not overly concerned about the upcoming midterm elections or local political developments, and it does not see anything coming that would cause concern. It noted that local development moratoriums generally do not remain permanent.
DE:F5W Earnings History
| Report Date | Fiscal Quarter | Forecast / EPS | Last Year's EPS | EPS YoY Change | Press Release |
|---|---|---|---|---|---|
| Feb 10, 2027 | 2026 (Q4) | 0.39- | 0.53 | ― | ― |
| Oct 21, 2026 | 2026 (Q3) | 0.420.39 | 0.44 | -10.20% (-0.04) | |
| Jul 22, 2026 | 2026 (Q2) | 0.400.52 | 0.38 | 38.10% (+0.14) | |
| Apr 22, 2026 | 2026 (Q1) | 0.290.97 | 0.32 | 200.00% (+0.64) | |
| Feb 04, 2026 | 2025 (Q4) | 0.380.53 | 0.46 | 13.46% (+0.06) | |
| Oct 15, 2025 | 2025 (Q3) | 0.350.44 | 0.67 | -34.67% (-0.23) | |
| Jul 16, 2025 | 2025 (Q2) | 0.340.38 | 0.35 | 7.69% (+0.03) | |
| Apr 16, 2025 | 2025 (Q1) | 0.330.32 | 0.46 | -30.77% (-0.14) | |
| Feb 05, 2025 | 2024 (Q4) | 0.320.46 | 0.6 | -22.39% (-0.13) | |
| Oct 16, 2024 | 2024 (Q3) | 0.340.67 | 0.51 | 31.58% (+0.16) |
The table shows recent earnings report dates and whether the forecast was beat or missed. See the change in forecast and EPS from the previous year.
