

Drdgold (DUBA) Q4 2026 Earnings Report
DE:DUBA Q4 2026 EPS Results
- Actual EPS
- EUR 1.45
- Consensus EPS
- ―
- Beat/Miss
- ―
- One Year Ago EPS
- EUR 0.71
DE:DUBA Q4 2026 Revenue Results
- Actual Revenue
- EUR 331.04M
- Expected Revenue
- EUR 363.51M
- Beat/Miss
- Missed by -EUR 32.48M
- YoY Revenue Growth
- +67.83%
Earnings Announcement Details
- Quarter
- Q4 2026
- Date
- 08/19/2026
- Time
- TBA
- Conference Call
- Wednesday, August 19, 2026
Drdgold's next earnings date is estimated for February 17, 2027, based on past reporting schedules.
Q4 2026 Earnings Call Audio
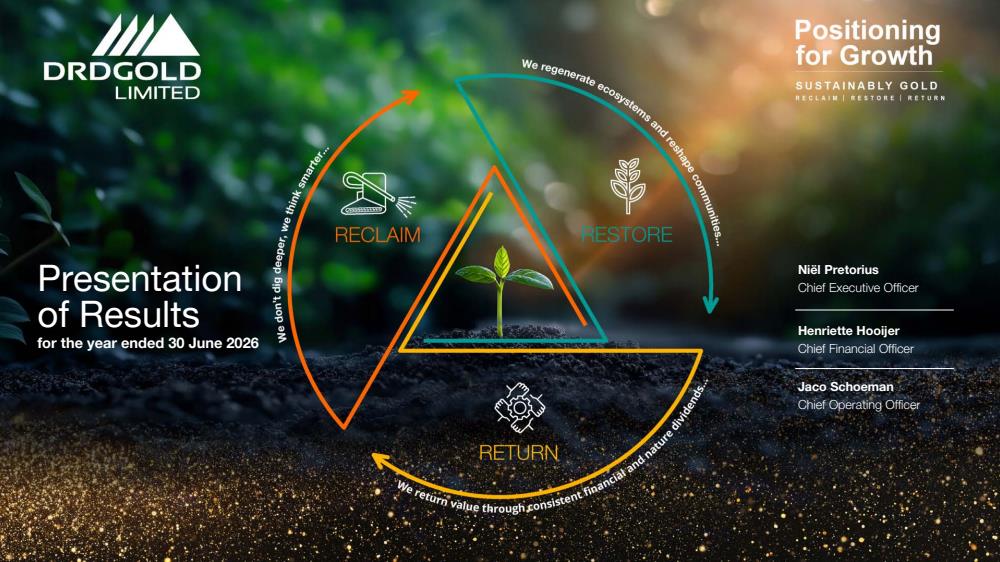
Q4 2026 Earnings Slide Deck
Q4 2026 Earnings Call Summary
The call communicated a materially positive operating and financial performance driven by a strong gold price, improved production (slightly ahead of guidance), substantial margin expansion and robust free cash generation despite a peak capital expenditure program. Key project milestones (Daggafontein, DP2 smelt house, pipeline progress and RTSF construction) were achieved, and sustainability metrics (water, carbon, energy intensity) improved markedly. Near-term headwinds include high ongoing capital spend, input cost inflation (diesel, reagents, trucking), and regulatory/weather timing risk around Withok and RTSF which could delay full throughput benefits. On balance, the positives (substantial profit, cash flow, project progress and sustainability gains) outweigh the manageable challenges and timing risks.
Guidance summary: management guided FY2027 production of 160,000–170,000 ounces, cash operating costs of just over ZAR 1.0 million/kg, all‑in sustaining costs around ZAR 1.2 million/kg and planned capital expenditure of just over ZAR 3.0 billion. Key operational milestones include commissioning DP2 (board visit planned in October), achieving beneficial occupation of the RTSF to enable full 1.2 million tonnes/month Far West throughput in Q1 FY2028 (RTSF ~800 million tonnes capacity, ~2/3 complete), commissioning the Libanon reclamation station, and securing Withok permits (Withok ≈310 million tonnes; construction aimed for completion in 2029). Daggafontein is commissioned at 25,000 t/day (≈750,000 t/month; ~120 million tonnes capacity), current managed throughput across the two operations is ~25 million tonnes, Kloof 2 added ~67 million tonnes to reserves (after ~23 million tonnes treated this year), and FY2026 context included ZAR 3.5 billion capex, ZAR 2.2 billion free cash flow and the declared final dividend of ZAR 1.20/share.
- Strong Revenue Growth Driven by Higher Gold PriceGroup revenue rose to just over ZAR 11 billion, a ~42% year-on-year increase, driven by a ~40% increase in the average gold price and modest growth in gold sold.
- Record Operating Profit and Headline EarningsOperating profit increased to ZAR 6.4 billion (an ~83% increase year-on-year) and headline earnings rose to ZAR 4.2 billion (an ~89% increase), reflecting improved margins and higher gold prices.
- Robust Free Cash Flow and DividendFree cash flow was strong at approximately ZAR 2.2–2.3 billion (an ~85% increase). The company declared a final cash dividend (reported as ZAR 1.20 per share) and earlier paid an interim dividend of ZAR 0.50 per share, with declared dividends representing ~65% of free cash flow for the year.
- Production Ahead of GuidanceGroup gold production finished just under 5 tonnes for the year and was ~5,000 ounces higher than the top end of guidance due to smart throughput mix management and improved plant yields (average yield just under 0.2 g/t, a ~2% increase).
- High Margins at Far WestFar West delivered revenue of ZAR 3.1 billion (vs ZAR 2.2 billion prior year) and exceptional operating margins (~76%). Far West cash operating cost was ~ZAR 561,000/kg with an all-in sustaining cost of ~ZAR 639,000/kg.
- Improved Unit Economics and Operating MarginsGroup operating margin improved from 45% to 58% and the all-in sustaining cost margin improved from 39% to 53% year-on-year, reflecting strong leverage to the gold price and disciplined cost control.
- Debt-Free, Increased Asset Base and Rehabilitation FundBalance sheet remains debt-free; property, plant and equipment increased to ZAR 11.9 billion (from ZAR 8.5 billion) reflecting ZAR 3.5 billion capital investment. Rehabilitation trust/insurance ring-fenced funds exceeded ZAR 1 billion.
- Sustainability and Efficiency GainsNotable sustainability improvements: potable water use down ~23% (saving ~900 million liters), carbon emissions down from ~303,000 t to ~233,000 t (~23% reduction), solar generation reported at ~146 GWh used, and Eskom-supplied units after wheeling reduced energy intensity (Eskom kWh per tonne treated decreased from 13.6 kWh/t in 2024 to 8.6 kWh/t). Safety indicators also trended positively.
- Major Project Milestones AchievedKey Vision 2028 milestones achieved: Daggafontein commissioning delivering ~25,000 t/day (750,000 t/month) capacity; DP2 smelt house commissioned and first gold bar produced at Far West; pipelines ~95% complete; RTSF ~two-thirds constructed with target to enable full 1.2 Mt/month throughput in early FY2028 (subject to weather/regulatory timing).
DE:DUBA Earnings History
| Report Date | Fiscal Quarter | Forecast / EPS | Last Year's EPS | EPS YoY Change | Press Release |
|---|---|---|---|---|---|
| Feb 17, 2027 | 2027 (Q2) | ―- | 0.12 | ― | ― |
| Aug 19, 2026 | 2026 (Q4) | ―1.45 | 0.71 | 103.87% (+0.74) | |
| Feb 18, 2026 | 2026 (Q2) | ―0.12 | 0.05 | 127.87% (+0.07) | |
| Aug 20, 2025 | 2025 (Q4) | ―0.71 | 0.41 | 75.11% (+0.31) | |
| Feb 18, 2025 | 2025 (Q2) | ―0.05 | 0.33 | -83.33% (-0.27) | |
| Aug 21, 2024 | 2024 (Q4) | ―0.41 | 0.42 | -3.78% (-0.02) | |
| Feb 14, 2024 | 2024 (Q2) | ―0.33 | 0.32 | 1.67% (+0.01) | |
| Aug 23, 2023 | 2023 (Q4) | ―0.42 | 0.42 | 0.21% (+0.00) | |
| Feb 15, 2023 | 2023 (Q2) | ―0.32 | 0.34 | -6.74% (-0.02) | |
| Aug 24, 2022 | 2022 (Q4) | ―0.42 | 0.35 | 20.25% (+0.07) |
The table shows recent earnings report dates and whether the forecast was beat or missed. See the change in forecast and EPS from the previous year.
