

Coca-Cola Europacific Partners (CK0) Q2 2026 Earnings Report
DE:CK0 Q2 2026 EPS Results
- Actual EPS
- EUR 2.20
- Consensus EPS
- EUR 2.20
- Beat/Miss
- Missed by -EUR 0.00
- One Year Ago EPS
- EUR 2.02
DE:CK0 Q2 2026 Revenue Results
- Actual Revenue
- EUR 11.16B
- Expected Revenue
- EUR 5.73B
- Beat/Miss
- Beat by +EUR 5.43B
- YoY Revenue Growth
- +11.48%
Earnings Announcement Details
- Quarter
- Q2 2026
- Date
- 08/04/2026
- Time
- Before Open
- Conference Call
- Tuesday, August 4, 2026
Coca-Cola Europacific Partners's next earnings date is estimated for February 18, 2027, based on past reporting schedules.
Q2 2026 Earnings Call Audio
Q2 2026 Earnings Slide Deck
Q2 2026 Earnings Call Summary
The call presented a predominantly positive operational and financial performance: strong revenue and volume growth, margin expansion, share gains, significant category momentum (especially Zero and Energy), robust execution (cooler rollout, World Cup activation) and continued cash generation and shareholder returns. Headwinds are manageable but notable: revenue-per-case softness versus a strong prior-year comparable, mix shifts to larger formats in Europe, the APS Suntory exit (~1% revenue impact), and cost/commodity timing risk concentrated in H2 (Middle East effects). Management reaffirmed full-year guidance and emphasized productivity and AI-driven improvements as mitigants. On balance, the highlights outweigh the lowlights.
Management reaffirmed full‑year 2026 guidance and said the Group is on track to deliver comparable free cash flow of at least EUR 1.7bn, after a strong H1 that included revenue of EUR 10.7bn (+6.1%), volumes +5.6% (or +2.2% days‑adjusted), revenue per case +0.4% (Q2 Europe ~+1.4%), operating profit EUR 1.5bn (+8.1%) with an operating margin of 13.8% (+~30 bps), diluted EPS EUR 2.20 (+10.6%) and H1 free cash flow EUR 435m; cost of sales per unit case rose 0.6% (below FY guidance of 1.5%), OpEx was 21.4% of revenue (‑~40 bps), value share up 20bps in Europe, ~EUR 600m of a EUR 1bn buyback completed, >80,000 coolers added (+5% year, >10% vs last year), category volumes showed sports/hydration +12%, energy +19%, Zero Sugar +10% (Monster share +230bps), and management noted the reaffirmation despite six fewer trading days in H2 and a c.1% H1 revenue headwind in APS from the Beam Suntory alcohol exit.
- Strong Top-Line GrowthRevenue of EUR 10.7 billion, up 6.1% year-over-year (comparable and FX-neutral). Volumes grew 5.6% (2.2% on a days-adjusted basis); June was the company's biggest volume month ever.
- Profitability and Cash GenerationOperating profit of EUR 1.5 billion, up 8.1%; operating margin expanded to 13.8%, up ~30 basis points. Diluted EPS EUR 2.20, up 10.6% (benefitting from buybacks). Free cash flow for H1 was EUR 435 million, slightly ahead of prior year, with comparable free cash flow guidance of at least EUR 1.7 billion for the full year reaffirmed.
- Volume and Category MomentumBroad-based volume growth across markets and categories: Zero Sugar volumes +10%, energy volumes +19% (Monster growing ~2x category rate), sports & hydration volumes +12%, and double-digit growth for Powerade in some markets.
- Share Gains and Customer WinsValue share grew by 20 basis points driven by Europe. Major customer and channel wins include Marriott International (600+ hotels), expanded Premiership coverage (80% of grounds), Domino's in Australia, and new listings like Smartwater and Fuze Tea in selected McDonald's markets.
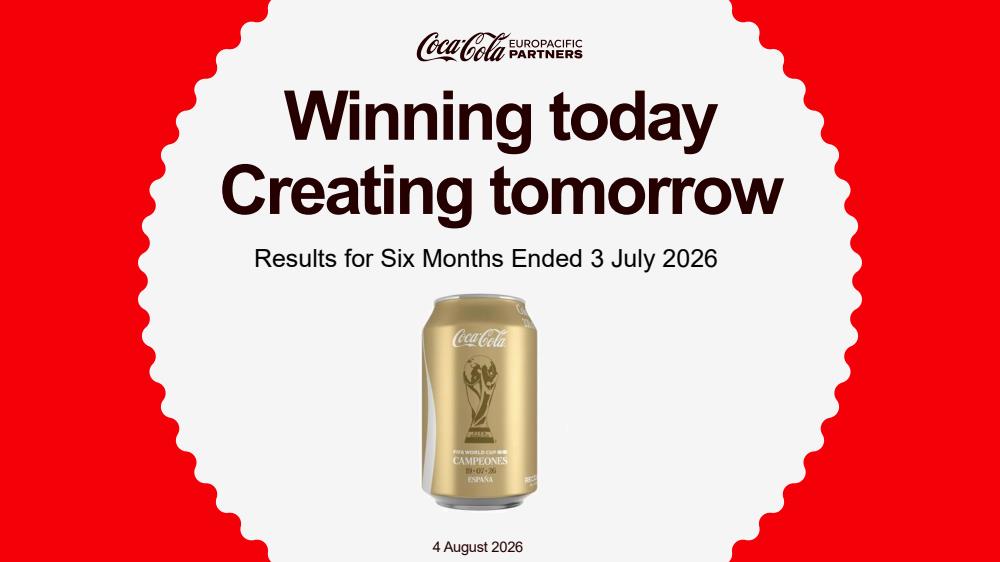
- Execution: Cooler Rollout and In-Market ActivationAdded >80,000 coolers this year (a ~5% increase year-to-date, >10% vs last year), improving cold availability and instant consumption. World Cup 2026 activation produced 163 million on-pack promotions, 135 million team/player cans and drove >1.3 million FIFA items to shoppers.
- Product and Geographic InnovationSuccessful product innovations and pack strategies (Supercans, new Cherry variants, Zero extensions). Southeast Asia progress: Indonesia sparkling growing ahead of category and Philippines delivering double-digit Coke Zero volume growth; Philippines margins approaching the ~10% target and new plant construction on track.
- Productivity, Cost Discipline and TechnologyOpEx improved (~40 basis points) to 21.4% of revenue due to discretionary spend savings and productivity programs. Cost of sales per unit case rose only 0.6% (below the FY guidance of 1.5%). Investment in AI/analytics (KIRA) and shared services (1,500 colleagues) is accelerating decision-making and commercial execution.
- Shareholder ReturnsAround EUR 600 million of the EUR 1 billion buyback completed in the first half, supporting EPS growth and returns to shareholders alongside dividends.
DE:CK0 Earnings History
| Report Date | Fiscal Quarter | Forecast / EPS | Last Year's EPS | EPS YoY Change | Press Release |
|---|---|---|---|---|---|
| Feb 18, 2027 | 2026 (Q4) | 2.27- | 2.09 | ― | ― |
| Aug 04, 2026 | 2026 (Q2) | 2.202.20 | 2.02 | 8.91% (+0.18) | |
| Feb 17, 2026 | 2025 (Q4) | 2.052.09 | 1.98 | 5.56% (+0.11) | |
| Jun 27, 2025 | 2025 (Q2) | 2.052.02 | 1.97 | 2.54% (+0.05) | |
| Feb 14, 2025 | 2024 (Q4) | 1.961.98 | 1.86 | 6.45% (+0.12) | |
| Aug 07, 2024 | 2024 (Q2) | 1.941.97 | 1.85 | 6.49% (+0.12) | |
| Feb 23, 2024 | 2023 (Q4) | 1.851.86 | 1.78 | 4.49% (+0.08) | |
| Aug 02, 2023 | 2023 (Q2) | 1.751.85 | 0.93 | 98.92% (+0.92) | |
| Feb 16, 2023 | 2022 (Q4) | 0.691.78 | 0.81 | 119.75% (+0.97) | |
| Aug 04, 2022 | 2022 (Q2) | 1.050.93 | 0.68 | 36.76% (+0.25) |
The table shows recent earnings report dates and whether the forecast was beat or missed. See the change in forecast and EPS from the previous year.