

Century Communities (CCT) Q3 2026 Earnings Report
DE:CCT Q3 2026 EPS Results
- Actual EPS
- EUR 0.90
- Consensus EPS
- EUR 1.07
- Beat/Miss
- Missed by -EUR 0.17
- One Year Ago EPS
- EUR 1.36
DE:CCT Q3 2026 Revenue Results
- Actual Revenue
- EUR 760.14M
- Expected Revenue
- EUR 848.06M
- Beat/Miss
- Missed by -EUR 87.92M
- YoY Revenue Growth
- -12.10%
Earnings Announcement Details
- Quarter
- Q3 2026
- Date
- 10/28/2026
- Time
- After Close
- Conference Call
- Wednesday, October 28, 2026
Century Communities's next earnings date is estimated for February 3, 2027, based on past reporting schedules.
Q3 2026 Earnings Call Audio
Q3 2026 Earnings Slide Deck
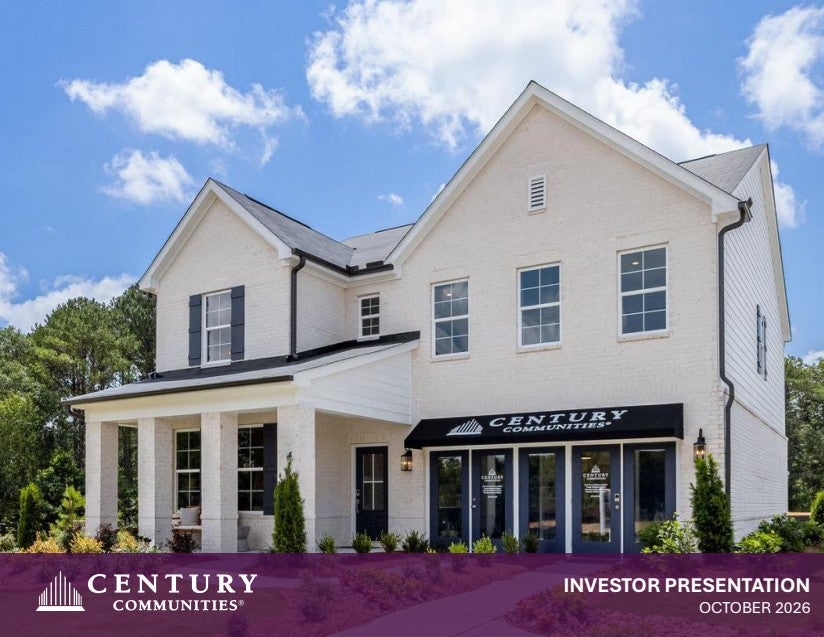
Q3 2026 Earnings Call Summary
The call reflected a difficult near-term housing environment, with higher mortgage rates, weaker consumer confidence, slower orders, lower deliveries, increased incentives, margin pressure, and reduced full-year guidance. These challenges were partially offset by record community growth, disciplined cost and land management, strong liquidity, a low cancellation rate, resilient Century Complete performance, and the strategic HistoryMaker acquisition. The positive operational and balance-sheet developments were meaningful but broadly balanced against the demand and profitability pressures.
Management expects to end 2026 with between 360 and 370 communities, including the contribution of 29 communities from HistoryMaker Homes, and expects incentives on closed homes in the fourth quarter of 2026 to be 200 to 250 basis points higher than third quarter levels. For the fourth quarter, SG&A as a percentage of home sales revenue is expected to be 14%, while full year 2026 SG&A as a percent of home sales revenue is expected to be roughly 14.5%, with fixed G&A expense accounting for approximately 70% of total SG&A at the mid-point of full year 2026 home sales revenue and SG&A guidance; the contribution margin percent from financial services is expected to be similar to third quarter levels, and the full year tax rate for 2026 is expected to be approximately 26%. Full year 2026 guidance, which includes approximately 100 deliveries from HistoryMaker, is now 9,350 to 9,650 home deliveries and home sales revenues in the range of $3.3 billion to $3.4 billion.
- Record Community Count and Expansion PlatformEnding community count increased 7% year over year and 4% sequentially to a company-record 343 communities. Management expects to end 2026 with between 360 and 370 communities, including 29 communities from HistoryMaker Homes.
- HistoryMaker Homes Acquisition Expands Dallas-Fort Worth PresenceCentury acquired HistoryMaker Homes in early October using proceeds from its revolving credit facility. The acquisition expands the Dallas division from 12 to 41 active communities and triples LTM deliveries from 211 to 669 homes. HistoryMaker adds entry-level and move-up products, local talent, land positions, and an ongoing relationship with its sister land development company.
- Operational Cost ManagementDirect construction costs, finished lot costs, and fixed G&A excluding advertising all decreased versus the prior quarter. Direct construction costs on delivered homes declined 2% sequentially, while finished lot costs declined 3% sequentially.
- Record Book Value Per ShareBook value per share increased to a new company record of $90.61.
- Low Cancellation RateNet orders totaled 2,284 homes in the third quarter, and the cancellation rate remained low at 14.6%, which management attributed to its qualification process and buyer commitment after sales acceptance.
- Century Complete Demonstrates Relative ResilienceCentury Complete accounted for 38% of third-quarter deliveries, and its community count increased 9% both sequentially and year over year to 122 communities, the second-highest level in its history. The business held up relatively well, with gross margins above the company average, supported by secondary-market locations, entry-level pricing, and Midwest exposure.
- Balance Sheet and Liquidity StrengthCentury ended the quarter with $2.6 billion in stockholders' equity and $864 million of liquidity. Third-quarter net homebuilding debt-to-net capital was 34.9%, and homebuilding debt-to-capital was 36.8%.
- Expanded Revolving Credit FacilityThe company amended its revolving credit facility, increasing capacity from $1 billion to $1.2 billion and extending maturity by two years to November 2030.
- Shareholder Returns and RepurchasesCentury maintained its quarterly cash dividend at $0.32 per share. It repurchased 170,000 shares for $12 million during the quarter and 1 million shares for $71 million through the first nine months of the year, equal to 4% of shares outstanding at the beginning of the year.
- Financial Services ContributionFinancial services generated $21 million of revenue and $6 million of pretax income in the third quarter. Management expects the fourth-quarter contribution margin percentage to be similar to third-quarter levels.
- Tax Rate BenefitThe third-quarter tax rate was 20.3%, benefiting from favorable adjustments related to additional energy tax credits claimed on homes closed before 2026. The full-year 2026 tax rate is expected to be approximately 26%.
- Long-Term Operating LeverageManagement said investments made over the past several years should allow Century to meaningfully grow annual deliveries to 15,000 homes or more without adding a material amount of fixed G&A.
- Move-Up Product ExpansionManagement said Century is increasing its percentage of move-up homes across its markets, not only in Dallas-Fort Worth. The HistoryMaker acquisition and the earlier Anglia acquisition in Houston both add move-up exposure.
- Flexible Land StrategyCentury ended the quarter with just over 60,000 owned and controlled lots. Its option lot count exceeded 27,000 lots and was secured by only $85 million of deposits, approximately 3% of equity. Management said it uses land banking arrangements on a very limited basis and does not cross-collateralize deals.
DE:CCT Earnings History
| Report Date | Fiscal Quarter | Forecast / EPS | Last Year's EPS | EPS YoY Change | Press Release |
|---|---|---|---|---|---|
| Feb 03, 2027 | 2026 (Q4) | 0.36- | 1.42 | ― | ― |
| Oct 28, 2026 | 2026 (Q3) | 1.070.90 | 1.36 | -33.55% (-0.46) | |
| Jul 22, 2026 | 2026 (Q2) | 0.571.16 | 1.22 | -5.11% (-0.06) | |
| Apr 22, 2026 | 2026 (Q1) | 0.530.79 | 1.21 | -35.29% (-0.43) | |
| Jan 28, 2026 | 2025 (Q4) | 1.201.42 | 2.86 | -50.31% (-1.44) | |
| Oct 22, 2025 | 2025 (Q3) | 0.731.36 | 2.43 | -44.12% (-1.07) | |
| Jul 23, 2025 | 2025 (Q2) | 1.001.22 | 2.37 | -48.30% (-1.14) | |
| Apr 23, 2025 | 2025 (Q1) | 1.521.21 | 1.98 | -38.74% (-0.77) | |
| Jan 29, 2025 | 2024 (Q4) | 2.842.86 | 2.62 | 9.22% (+0.24) | |
| Oct 23, 2024 | 2024 (Q3) | 2.292.43 | 2.3 | 5.43% (+0.12) |
The table shows recent earnings report dates and whether the forecast was beat or missed. See the change in forecast and EPS from the previous year.