

Carlsberg AS (CBGB) Price & Analysis
CBGB Stock Chart & Stats
€130.30€2.60(2.04%)
At close: 4:00 PM EDT
- Day’s Range
- EUR 128.90 - EUR 130.30
- 52-Week Range
- EUR 100.45 - EUR 152.80
- Previous Close
- EUR 127.70
- Volume
- 84
- Average Volume (3M)
- 57
- Market Cap
- EUR 17.66B
- Enterprise Value
- EUR 180.08B
- Total Cash (Recent Filing)
- EUR 11.60B
- Total Debt (Recent Filing)
- EUR 38.14B
- Price to Earnings (P/E)
- 20.1
- Beta
- 0.76
- Next Earnings
- Feb 09, 2027
- EPS Estimate
- 1.75
- Next Dividend Ex-Date
- N/A
- Dividend Yield
- 2.98%
Carlsberg AS News








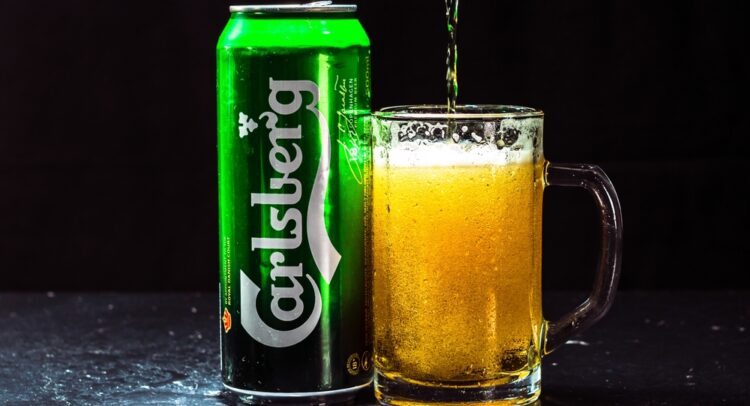
CBGB FAQ
What was Carlsberg AS’s price range in the past 12 months?
Carlsberg AS lowest stock price was €100.45 and its highest was €152.80 in the past 12 months.
What is Carlsberg AS’s market cap?
Carlsberg AS’s market cap is €17.66B.
When is Carlsberg AS’s upcoming earnings report date?
Carlsberg AS’s upcoming earnings report date is Feb 09, 2027 which is in 100 days.
How were Carlsberg AS’s earnings last quarter?
Carlsberg AS released its earnings results on Aug 19, 2026. The company reported €3.042 earnings per share for the quarter, missing the consensus estimate of €3.149 by -€0.107.
Is Carlsberg AS overvalued?
According to Wall Street analysts Carlsberg AS’s price is currently Undervalued.
Does Carlsberg AS pay dividends?
Carlsberg AS does not currently pay dividends.
What is Carlsberg AS’s EPS estimate?
Carlsberg AS’s EPS estimate is 1.75.
How many shares outstanding does Carlsberg AS have?
Carlsberg AS has 98,957,560 shares outstanding.
What happened to Carlsberg AS’s price movement after its last earnings report?
Carlsberg AS reported an EPS of €3.042 in its last earnings report, missing expectations of €3.149. Following the earnings report the stock price went down -2.857%.
Which hedge fund is a major shareholder of Carlsberg AS?
Currently, no hedge funds are holding shares in DE:CBGB
What is the TipRanks Smart Score and how is it calculated?
Smart Score combines eight research factors - such as analyst recommendations, hedge fund trends, and technical indicators - to measure a stock’s outlook. These signals are unified into a single score that reflects bullish or bearish momentum. See detailed methodology
Company Description
Carlsberg AS
Carlsberg A/S is a Danish corporation primarily engaged in the manufacturing and marketing of beer and various other beverages. Its extensive product offerings include staple, artisanal, and specialized beers, alongside a selection of non-alcoholic options. These products are prominently sold under a variety of brands, including Carlsberg, Tuborg, Feldschlösschen, Baltika, Chongqing, 1664 Blanc, Grimbergen, Ringnes, and Somersby. The company, established in 1847 and based in Copenhagen, Denmark, also boasts a significant international presence, exporting its goods to approximately 100 nations worldwide.
- Sector
- General
- Industry
- Beverages - Alcoholic
- CEO
- Jacob Aarup-Andersen
- Employees
- 36,527
- Website
- www.carlsberggroup.com
- Address
- 1 J. C. Jacobsens Gade, Copenhagen, CR, 1799, DK
Carlsberg AS (CBGB) Earnings & Revenues
CBGB Stock 12 Month Forecast
Average Price Target
EUR 139.05▲(6.72% Upside)
Past 12 Months12 Month ForecastJan2026Oct2026
HighEUR 155.22
AverageEUR 139.05
LowEUR 123.10
Technical Analysis
Overall Consensus
| Indicator | Bullish | Neutral | Bearish |
|---|---|---|---|
| Overall Consensus | 15 | 3 | 4 |
| Technical Analysis | 3 | 3 | 4 |
| Moving Averages | 12 | 0 | 0 |