


CellaVision AB earnings date
CellaVision AB (C26) Q3 2026 Earnings Report
DE:C26 Q3 2026 EPS Results
- Actual EPS
- EUR 0.16
- Consensus EPS
- EUR 0.13
- Beat/Miss
- Beat by +EUR 0.03
- One Year Ago EPS
- EUR 0.12
DE:C26 Q3 2026 Revenue Results
- Actual Revenue
- EUR 18.20M
- Expected Revenue
- EUR 17.60M
- Beat/Miss
- Beat by +EUR 604.77K
- YoY Revenue Growth
- +13.59%
Earnings Announcement Details
- Quarter
- Q3 2026
- Date
- 10/29/2026
- Time
- Before Open
- Conference Call
- Thursday, October 29, 2026
CellaVision AB's next earnings date is estimated for February 4, 2027, based on past reporting schedules.
Q3 2026 Earnings Call Audio
Q3 2026 Earnings Slide Deck
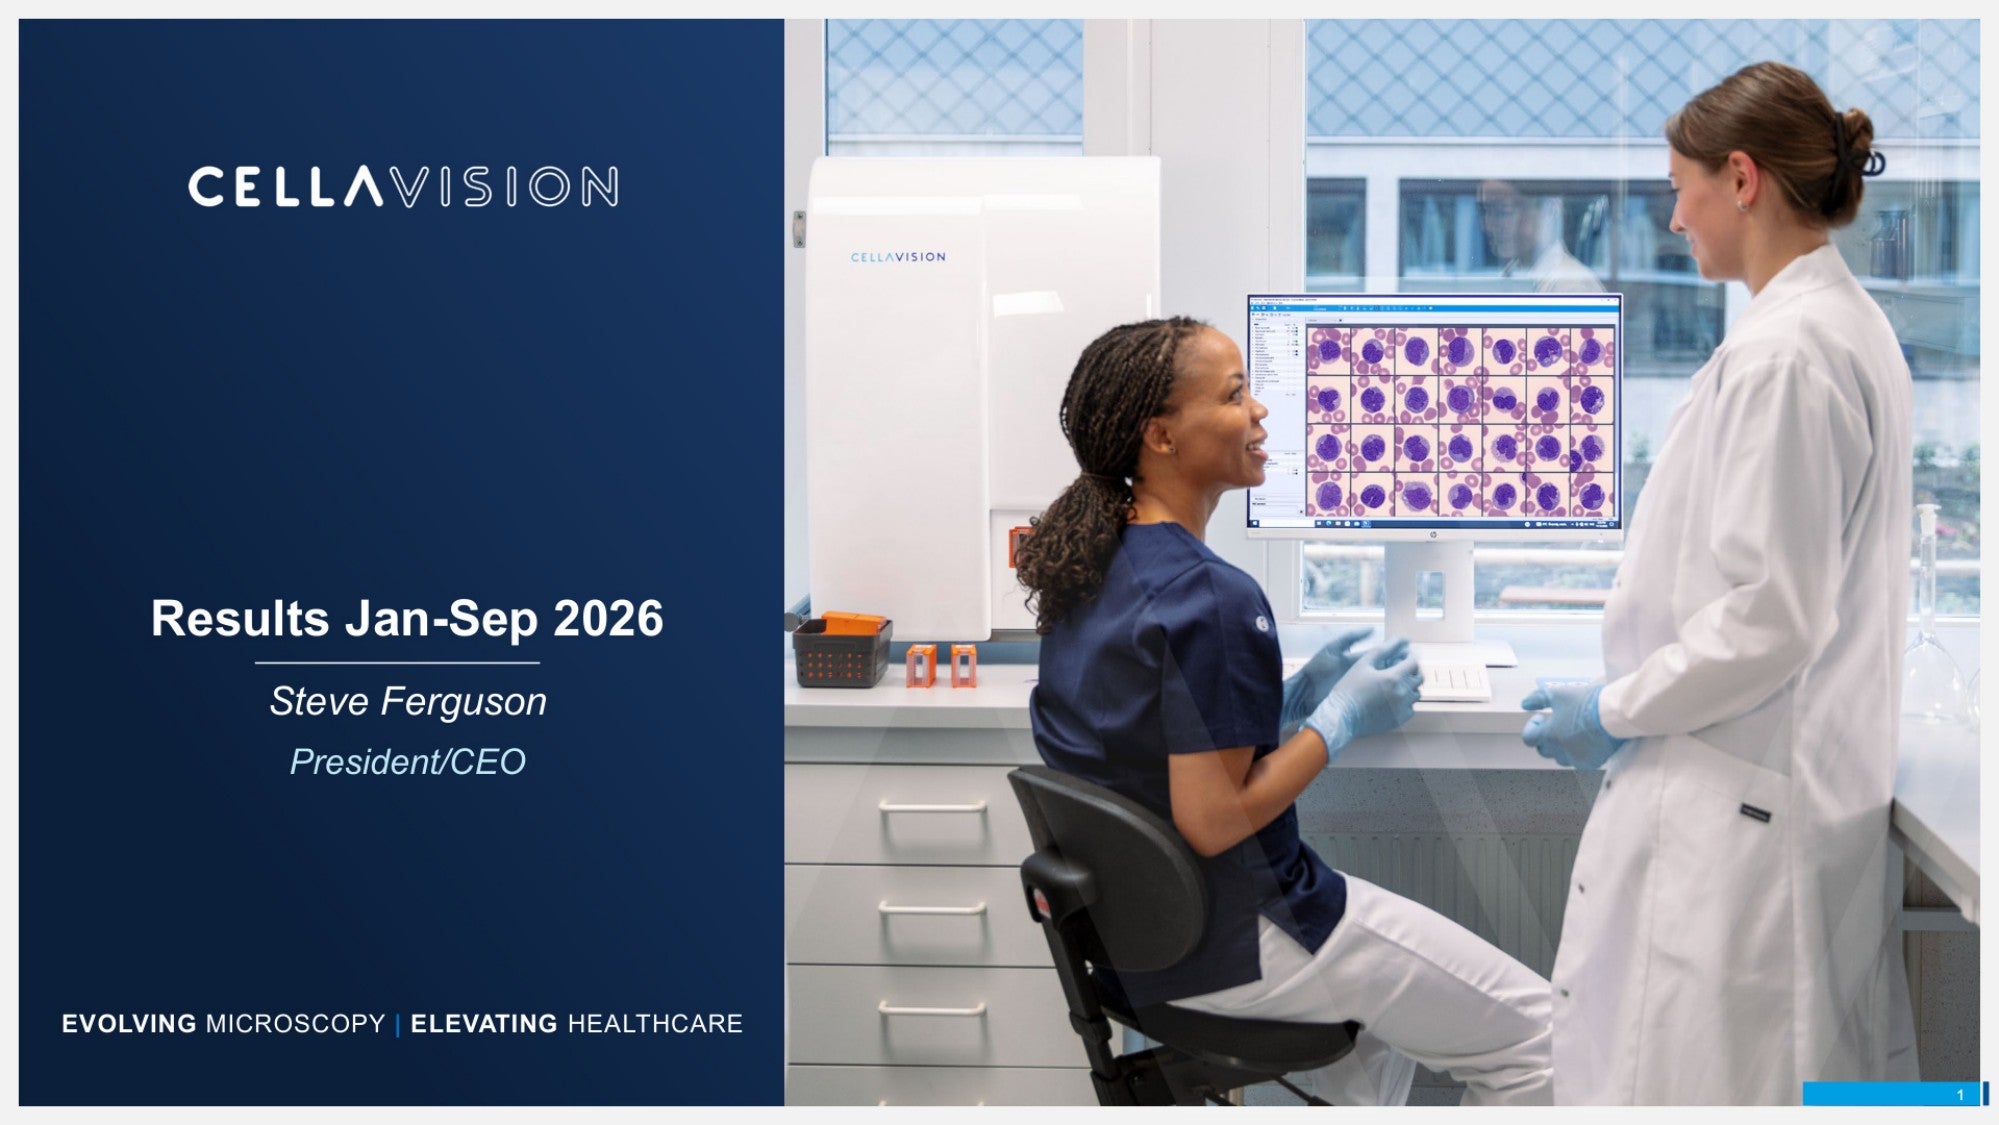
Q3 2026 Earnings Call Summary
The call was strongly positive overall. Revenue, EBITDA, Americas, APAC, reagents, software, recurring revenue, cash flow, and the innovation pipeline all showed solid progress. The main challenges were the 10% EMEA year-over-year decline, gross-margin effects from amortization and mix, healthcare investment pressure in China and EMEA, and a tougher APAC comparison ahead.
Management aims to obtain FDA 510(k) market clearance before the end of this year; Bone Marrow Aspirate sales in the quarter are expected to be around 1% to 2% of the growth; amortization is expected to stay on this level until the next product is launched; America remains a growth case with opportunities for growth, instrument sales are expected to continue to grow, and reagent revenue is expected to develop positively; there are no particular trends in Q4 that poses any surprises; R&D is expected to be on a more towards 20%, 21% of sales level rather than the 19% recorded in Q3; price increases are very rough following inflation; and APAC’s next-quarter comparison will be a little tougher because Q4 last year included some sales in China, while current sales there are very limited.
- Strong Quarterly Revenue GrowthNet sales reached SEK 200 million, increasing 13.6% year over year, with organic growth of 13.4% and only a minor currency effect. Year-to-date organic growth was 4% despite the weaker first quarter.
- Higher EBITDA and Strong MarginEBITDA increased to SEK 64 million, corresponding to a 32% EBITDA margin.
- Americas Delivered Exceptional GrowthAmericas sales increased 32% to SEK 89 million, driven primarily by strong demand for large connected instrument platforms and a notable software contribution. Small instrument sales also continued to recover.
- Significant Canadian Tender WinA significant tender win in Canada resulted in a large installation and contributed to Americas growth. Management stated that the quarter included a balance of new business wins and instrument refreshes.
- Positive Outlook for AmericasManagement remains confident that America is a growth case, citing high demand for connected laboratory solutions, laboratory consolidation, customer efficiency needs, a strong partner relationship, and reasonable visibility into future opportunities.
- APAC Growth Outside ChinaAPAC grew approximately 90% to 91% organically in the quarter, with growth outside China across both instruments and reagents and across South Asia and East Asia.
- Japan Reagent ConversionJapan delivered notable momentum through the conversion of the installed base to CellaVision reagents, including a win with one of the largest national laboratory testing chains. Management expects this business to provide recurring revenue over years.
- Bone Marrow Aspirate AdoptionThe Bone Marrow Aspirate application progressed from customer evaluations to first revenue and initial installations in EMEA. Positive customer feedback is leading to early adoption, and management expects sales from the application to represent around 1% to 2% of growth in the quarter.
- Bone Marrow Regulatory ProgressThe FDA 510(k) review for Bone Marrow Aspirate is ongoing in the United States, with the aim of obtaining market clearance before the end of the year.
- FPM and Next-Generation Analyzer PipelineFPM technology and next-generation hematology analyzers are progressing through key development phases toward future market introduction. Management described the platform as offering meaningfully higher image quality and substantially higher throughput than what is currently available, while also opening opportunities in pathology and cytology.
- Reagent and Software Sales GrowthInstrument sales were SEK 105 million, up 14%; reagent sales were SEK 45 million, up 12%; and software and spare parts sales were SEK 49 million, up 15%, with software growth driven by the Americas.
- Recurring Revenue DevelopmentReagent growth strengthened across EMEA and APAC. Management emphasized that reagent revenue is recurring, grows with testing volumes, and forms an important part of CellaVision's combined microscopy and reagent value proposition.
- Cash Flow and Financial PositionOperating cash flow was SEK 68 million, supported by higher sales and reduced inventory. Cash flow for the quarter was stated as SEK 46 million, and cash and cash equivalents were SEK 219 million, which management characterized as a robust financial position.
- Continued R&D InvestmentCellaVision continued to invest in R&D at 19% of net sales, with investment programs developing and maturing according to plan. Management expects R&D investment to be more toward 20% to 21% of sales rather than the 19% reported in Q3. Most additional employees are being added to R&D in Lund, with some replacing consultants.
- Price Increases ImplementedPrice increases introduced in Q2 had their full effect in Q3, with the magnitude described as roughly following inflation.
- Strategy and Innovation MomentumManagement stated that the Power of Focus strategy delivered commercial and regulatory progress, including the Bone Marrow Aspirate launch. An updated strategy covering priorities through 2030 will be presented at the Capital Markets Day on February 17.
DE:C26 Earnings History
| Report Date | Fiscal Quarter | Forecast / EPS | Last Year's EPS | EPS YoY Change | Press Release |
|---|---|---|---|---|---|
| Feb 04, 2027 | 2026 (Q4) | 0.19- | 0.16 | ― | ― |
| Oct 29, 2026 | 2026 (Q3) | 0.130.16 | 0.12 | 32.18% (+0.04) | |
| Jul 17, 2026 | 2026 (Q2) | 0.120.12 | 0.15 | -14.37% (-0.02) | |
| Apr 24, 2026 | 2026 (Q1) | 0.140.09 | 0.16 | -44.71% (-0.07) | |
| Feb 05, 2026 | 2025 (Q4) | 0.120.16 | 0.16 | 5.88% (+0.01) | |
| Nov 06, 2025 | 2025 (Q3) | 0.100.12 | 0.12 | 0.38% (+0.00) | |
| Jul 18, 2025 | 2025 (Q2) | 0.150.15 | 0.15 | 0.00% (+0.00) | |
| Apr 29, 2025 | 2025 (Q1) | 0.130.16 | 0.12 | 30.77% (+0.04) | |
| Feb 06, 2025 | 2024 (Q4) | 0.170.16 | 0.19 | -19.05% (-0.04) | |
| Oct 24, 2024 | 2024 (Q3) | 0.160.12 | 0.1 | 18.18% (+0.02) |
The table shows recent earnings report dates and whether the forecast was beat or missed. See the change in forecast and EPS from the previous year.
