


Mapletree Pan Asia Commercial Trust earnings date
Mapletree Pan Asia Commercial Trust (BI0) Q2 2027 Earnings Report
DE:BI0 Q2 2027 EPS Results
- Actual EPS
- EUR 0.01
- Consensus EPS
- EUR 0.01
- Beat/Miss
- Missed by -EUR 0.00
- One Year Ago EPS
- EUR 0.01
DE:BI0 Q2 2027 Revenue Results
- Actual Revenue
- EUR 146.92M
- Expected Revenue
- EUR 150.88M
- Beat/Miss
- Missed by -EUR 3.96M
- YoY Revenue Growth
- -5.06%
Earnings Announcement Details
- Quarter
- Q2 2027
- Date
- 10/29/2026
- Time
- After Close
- Conference Call
- Thursday, October 29, 2026
Mapletree Pan Asia Commercial Trust's next earnings date is estimated for February 3, 2027, based on past reporting schedules.
Q2 2027 Earnings Call Audio
Q2 2027 Earnings Slide Deck
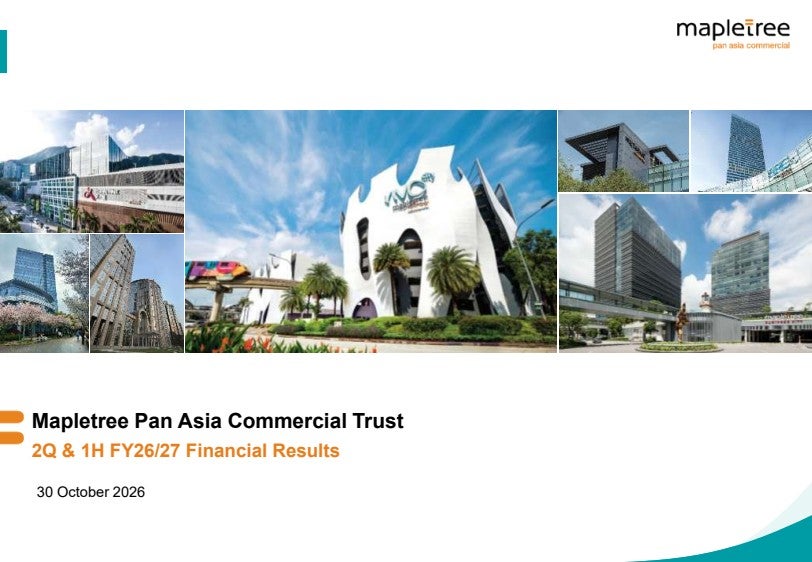
Q2 2027 Earnings Call Summary
The call presented clear strengths in Singapore, particularly VivoCity and the improving MBC leasing pipeline, supported by lower financing expenses, strong liquidity, disciplined hedging and ongoing asset optimization. However, these positives were outweighed by year-on-year declines in revenue, NPI and overseas contributions, severe China weakness, continued Festival Walk rental pressure, Japan and Fujitsu-related challenges, expected cost of debt above 3%, and management's acknowledgment that China will continue to decline in the next year or so. The near-term outlook is therefore cautious to negative despite constructive longer-term initiatives.
Management expects to end this financial year with the cost of debt “above 3%, hopefully should be below the 3.16% a year ago, but it's likely to be 3%,” with some savings from swapping out the Sing dollar interest rate swap, while MBC physical occupancy should be “north of 92%, 93%” by the end of the financial year, with “about 6%” of committed space starting rental payment on “1st of November.” Festival Walk’s AEI is expected to have “a bit of downtime next year” and “positive ROI,” with the asset’s yield expected to “hover around the 3-ish,” specifically “3.3% to 3.6%,” representing a “10% increase in NPI there.” VivoCity has “2 big ones” in “very advanced planning,” with “a good 2-year program,” “positive ROI,” and some disruption, while China is expected to “continue to go down in the next year or so,” with the magnitude “way more than Festival Walk.”
- Singapore Revenue Growth and Portfolio ResilienceSingapore gross revenue grew 1.2% year-on-year in the first half, and Singapore properties continued to underpin MPACT's resilience. Contributions from Singapore properties remained steady in the second quarter.
- VivoCity Performance Benefiting from AEIVivoCity gross revenue increased 7.5% and NPI increased 6.9% year-on-year in the first half, following completion of the B2 AEI. VivoCity remains fully committed, while shopper traffic increased slightly and tenant sales rose 4.1% year-on-year in the quarter.
- Positive VivoCity Rental ReversionVivoCity recorded a 15% rental reversion year-to-date. Management attributed the performance to the AEI, tenant remixing, events, the Circle Line connection and continued lease-by-lease optimization.
- Further VivoCity AEI PlansManagement said it is in an advanced planning stage for two major VivoCity AEIs expected to support the mall for another two years. The plans include converting back-of-house areas into front-of-house space, creating new retail clusters, retrieving and redeploying GFA into higher-yielding uses, and minimizing disruption. Management stated that the initiatives are expected to have positive ROI.
- MBC Leasing ProgressMBC committed occupancy increased from 94.3% to 95.4%. Committed leases are expected to contribute revenue progressively from the third quarter, with a major portion beginning rental payments on 1 November. Physical occupancy was expected to reach above 92% to 93% by the end of the financial year.
- Core Assets Anchor EarningsVivoCity and MBC together contributed 58% of gross revenue and 59% of NPI in the first half, continuing to anchor portfolio earnings.
- Strong Occupancy at Key AssetsFestival Walk remained 99.9% committed, VivoCity remained fully committed, and Pinnacle Gangnam remained fully committed except for a small basement F&B unit. Pinnacle Gangnam delivered a 30% rental reversion.
- Positive Rental Reversions in SingaporeMBC continued to record positive rental reversions, while other Singapore properties recorded a slightly positive 5.5% rental reversion as general office sentiment improved.
- Hong Kong Retail Sales ImprovementFestival Walk shopper traffic increased 6.7% and tenant sales increased 3.9% year-on-year, driven largely by F&B and selected luxury categories, including jewelry. Management also reported that F&B remained strong in generating mall traffic.
- Festival Walk Reconfiguration ProgramFestival Walk is progressing with plans to resize and reconfigure the cinema cluster into a combination of entertainment and F&B, resize portions of the MTR floor, and subdivide larger units to better match current tenant requirements. Management expects a positive ROI, although there will be some downtime next year.
- Festival Walk F&B Reconfiguration SuccessThe conversion of an H&M unit into four restaurants produced more than a 50% change in the relevant numbers and supported higher sales and footfall. Management plans to widen the mall's F&B offering.
- Lower Operating and Financing ExpensesProperty operating expenses declined 1.2% year-on-year in the second quarter, primarily due to divestments. Finance expenses declined 10.1% in the quarter and 14.4% to $83.4 million in the first half, reflecting lower rates on Singapore-dollar borrowings and debt reductions.
- Improved Cost of Debt and HedgingWeighted average all-in cost of debt declined to 2.95% from 3.23% a year ago. Of total gross debt, 71.8% was fixed-rate or hedged through interest-rate swaps, and approximately 94% of distributable income was derived from or hedged into Singapore dollars.
- Liquidity and Debt Maturity ManagementGross borrowings stood at $5.9 billion, aggregate leverage was 38.1%, and interest coverage was 3.3x on a trailing 12-month basis. MPACT had approximately $0.6 billion of cash and undrawn committed facilities. No more than 22% of debt falls due in any single financial year, and facilities are already in place to refinance the remaining borrowings due in those years.
- Stable NAV and DistributionNAV per unit remained relatively stable at $1.73 as of 30 September 2026. Second-quarter DPU was $0.0194 and first-half DPU was $0.0390, with the second-quarter distribution scheduled for 16 December 2026.
- Portfolio Optimization ProgressManagement said it had trimmed approximately $1.2 billion of assets over the previous two years for reasons including better offers, higher yields and future tenancy risks. It intends to continue evaluating weaker-yielding assets and potential replacements that could strengthen the portfolio.
- Potential Makuhari Leasing MomentumLeasing inquiries in Makuhari have increased compared with one or two years ago, partly because rising Central Tokyo rents are prompting tenants to consider suburban locations. MPACT is in preliminary discussions with tenants seeking approximately 50,000 to 100,000 square feet, including a potential tenant that could take an entire property, although leases would not begin immediately.
- Greater Southern Waterfront OpportunityManagement said the Greater Southern Waterfront redevelopment, increased residential population and positive tourism-related developments around Sentosa are expected to benefit VivoCity. MPACT is not involved in residential development but expects VivoCity to benefit from the surrounding developments.
DE:BI0 Earnings History
| Report Date | Fiscal Quarter | Forecast / EPS | Last Year's EPS | EPS YoY Change | Press Release |
|---|---|---|---|---|---|
| Feb 03, 2027 | 2027 (Q3) | 0.01- | 0.01 | ― | ― |
| Oct 29, 2026 | 2027 (Q2) | 0.010.01 | 0.01 | -5.00% (-0.00) | |
| Jul 30, 2026 | 2027 (Q1) | 0.010.01 | 0.01 | -10.53% (-0.00) | |
| Apr 28, 2026 | 2026 (Q4) | 0.01-0.00 | 0.05 | -106.67% (-0.06) | |
| Jan 29, 2026 | 2026 (Q3) | 0.010.01 | 0.01 | 11.11% (+0.00) | |
| Oct 22, 2025 | 2026 (Q2) | 0.010.01 | 0 | 1100.00% (+0.02) | |
| Jul 30, 2025 | 2026 (Q1) | 0.010.01 | 0.01 | -9.52% (-0.00) | |
| Apr 24, 2025 | 2025 (Q4) | 0.010.05 | 0.03 | 53.06% (+0.02) | |
| Jan 23, 2025 | 2025 (Q3) | 0.010.01 | 0.02 | -18.18% (-0.00) | |
| Oct 24, 2024 | 2025 (Q2) | 0.01-0.00 | 0.01 | -110.00% (-0.02) |
The table shows recent earnings report dates and whether the forecast was beat or missed. See the change in forecast and EPS from the previous year.
