


Boss Energy earnings date
Boss Energy (B8Y) Q4 2026 Earnings Report
DE:B8Y Q4 2026 EPS Results
- Actual EPS
- EUR 0.02
- Consensus EPS
- EUR 0.01
- Beat/Miss
- Beat by +EUR 0.01
- One Year Ago EPS
- -EUR 0.04
DE:B8Y Q4 2026 Revenue Results
- Actual Revenue
- EUR 42.69M
- Expected Revenue
- EUR 21.47M
- Beat/Miss
- Beat by +EUR 21.22M
- YoY Revenue Growth
- +149.10%
Earnings Announcement Details
- Quarter
- Q4 2026
- Date
- 08/26/2026
- Time
- After Close
- Conference Call
- Wednesday, August 26, 2026
Boss Energy 's next earnings date is estimated for March 2, 2027, based on past reporting schedules.
Q4 2026 Earnings Call Audio
Q4 2026 Earnings Slide Deck
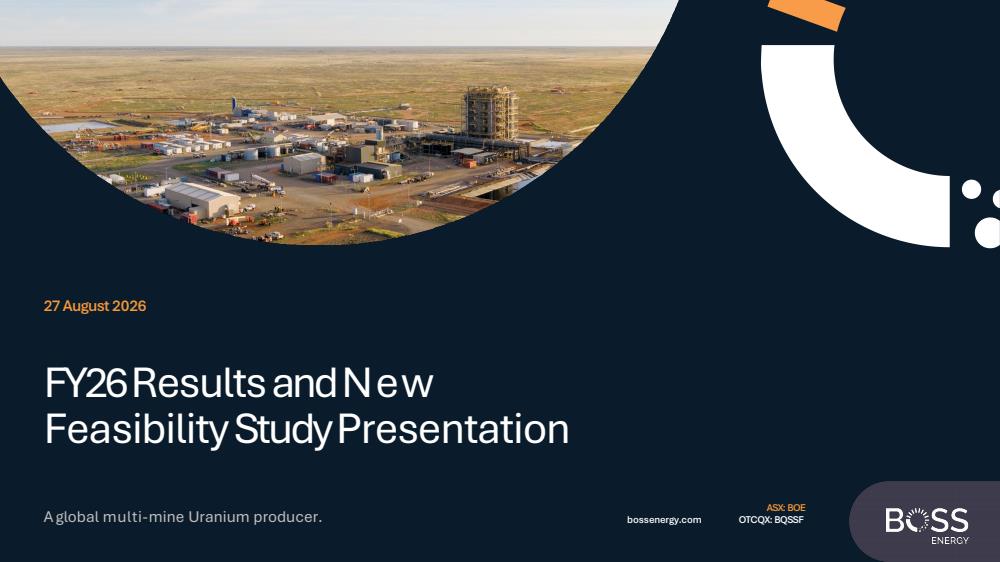
Q4 2026 Earnings Call Summary
The call presented a predominantly positive strategic and operational outlook: Boss delivered strong FY2026 operational and financial outcomes (revenue doubled, positive cash generation, debt‑free balance sheet, meaningful inventory and market value upside) and released a materially improved feasibility study that reduces life‑of‑mine costs and development intensity via a wide‑spacing ISR design. Key risks remain — chiefly a significant downgrade of the previously reported resource, reliance on inferred tonnes for later years, and a critical water treatment plant bottleneck that constrains near‑term ramp rates and introduces schedule/capital uncertainty. However, the strengthened technical modelling, clear execution priorities, strong balance sheet and regional growth optionality (Gould's/Jasons) mean the positives materially outweigh the negatives.
Boss guided FY2027 production of 1.25–1.30M lb U3O8 with C1 cost A$51–56/lb, all‑in sustaining cost A$83–92/lb, sustaining capital A$33–37M, processing (plant) capital A$25–28M and total FY27 capex A$58–64M; the company expects eight wellfields operating by June 2027 (EKT1 Q2, EKT2 Q4) and cites the staged water‑treatment build (Stage 1 ≈130 m3/hr targeted Q1 FY27, Stage 2 ≈300 m3/hr targeted Q3 FY28) as the critical bottleneck to ramp‑up. The feasibility study underpinning the guidance targets ~13.8M lb drum production over nine years to FY2034 (peak ~1.9M lb/yr), life‑of‑mine C1 ≈A$50/lb and AISC ≈A$79/lb, a 49 m injector‑to‑extractor spacing with ~59 wellfields (~134,000 wells), modeled recoveries rising from ~80% to ~90%, residence time ≈150 days (vs ~80), uranium per extraction well ≈33,000 lb (vs 15,400), extraction flow ≈32 m3/hr, acid ~8 kg/t (vs ~6), and ~26 pore volumes to achieve 90% recovery.
- Revenue Doubling and ProfitabilitySales revenue doubled year-over-year to AUD 151.1 million (from AUD 76 million), delivering a FY2026 net profit after tax of ~AUD 2.5 million and marking the first year of positive free cash flow.
- Strong Cash Position and Debt-Free Balance SheetClosed FY2026 with AUD 207.3 million in cash and liquid assets, no debt, total net assets of AUD 477.6 million, and operating cash flow of AUD 73.6 million (up from AUD 17 million, ~+333%).
- Inventory Strategic Positioning and Mark-to-Market UpsideDrummed uranium inventory increased to 1.58 million lbs (up 172,000 lbs, ~+12%), carried at book value AUD 116 million but with a market value of ~AUD 195 million at 30 June spot (implying ~AUD 79 million unrealized upside, ~+68% vs book).
- Material Production Increase and Operating EfficiencyHoneymoon production increased 61% to 1.41 million lbs (from 872,000 lbs), demonstrating significant operating scale-up; FY2026 C1 cost was AUD 39/lb and AISC AUD 61/lb, both within revised guidance.
- New Feasibility Study Establishes Low-Cost Wide‑Spacing DesignNew feasibility study (NFS) endorses a 49 m injector-extractor wide‑spacing design, projecting 13.8 million lbs of drum production over ~9 years, peak annual production ~1.9 million lbs, and a life-of-mine C1 around AUD 50/lb and AISC ~AUD 79/lb.
- Quantified Unit-Cost Improvements from Wide SpacingWide-spacing design materially improves economics: like‑for‑like life-of-mine AISC reduced by ~AUD 30/lb (one comparison shows ~AUD 34/lb or ~31% decrease); modeling shows average PLS tenor +28% and modeled recovery improving from ~80% to ~90%.
- Substantial Reduction in Development Intensity per WellfieldMoving from historic 35 m spacing to 49 m spacing reduces number of wells by ~46% and number of eight-pattern wellfields by ~54%; uranium recovered per extraction well increases from ~15,400 lbs to ~33,000 lbs (>+100%).
- Technical and Modelling AdvancesIntroduced reactive transport modeling calibrated to historic Uranium One and current operating data, enabling deposit‑specific production curves, permeability-based resource extractability, and more predictive wellfield and reagent forecasting.
- Disciplined Capital Deployment and FY2027 GuidanceReinvested AUD 66.6–66.8 million in development during FY2026 while remaining cash positive; FY2027 transitional guidance: production 1.25–1.3 million lbs, C1 AUD 51–56/lb, AISC AUD 83–92/lb, sustaining capital AUD 33–37 million and processing capital AUD 25–28 million (total AUD 58–64 million).
- Regional Growth OptionalityBoss controls additional district resources (combined district resource 65.9 million lbs including Gould's Dam and Jasons). Company views Gould's and Jasons as potential low‑capex extensions/production sources leveraging Honeymoon infrastructure.
DE:B8Y Earnings History
| Report Date | Fiscal Quarter | Forecast / EPS | Last Year's EPS | EPS YoY Change | Press Release |
|---|---|---|---|---|---|
| Mar 02, 2027 | 2027 (Q2) | 0.03- | -0.01 | ― | ― |
| Aug 26, 2026 | 2026 (Q4) | 0.010.02 | -0.04 | 141.67% (+0.05) | |
| Feb 25, 2026 | 2026 (Q2) | 0.03-0.01 | -0.01 | 17.39% (+0.00) | |
| Aug 28, 2025 | 2025 (Q4) | -0.04-0.04 | -0.03 | -33.33% (-0.01) | |
| Feb 26, 2025 | 2025 (Q2) | -0.01-0.01 | 0.1 | -114.38% (-0.11) | |
| Aug 28, 2024 | 2024 (Q4) | 0.01-0.03 | 0.03 | -207.14% (-0.05) | |
| Feb 27, 2024 | 2024 (Q2) | 0.080.10 | 0 | 2385.71% (+0.10) | |
| Sep 06, 2023 | 2023 (Q4) | 0.010.03 | -0.02 | 268.00% (+0.04) | |
| Mar 10, 2023 | 2023 (Q2) | ―-0.00 | 0.03 | -113.21% (-0.04) | |
| Sep 28, 2022 | 2022 (Q4) | -0.03-0.02 | 0.01 | -377.78% (-0.02) |
The table shows recent earnings report dates and whether the forecast was beat or missed. See the change in forecast and EPS from the previous year.
