

Outfront Media (76C0) Q2 2026 Earnings Report
DE:76C0 Q2 2026 EPS Results
- Actual EPS
- EUR 0.39
- Consensus EPS
- EUR 0.34
- Beat/Miss
- Beat by +EUR 0.05
- One Year Ago EPS
- EUR 0.09
DE:76C0 Q2 2026 Revenue Results
- Actual Revenue
- EUR 467.85M
- Expected Revenue
- EUR 456.31M
- Beat/Miss
- Beat by +EUR 11.54M
- YoY Revenue Growth
- +13.54%
Earnings Announcement Details
- Quarter
- Q2 2026
- Date
- 08/05/2026
- Time
- After Close
- Conference Call
- Wednesday, August 5, 2026
Outfront Media's next earnings date is estimated for November 5, 2026, based on past reporting schedules.
Q2 2026 Earnings Call Audio
Q2 2026 Earnings Slide Deck
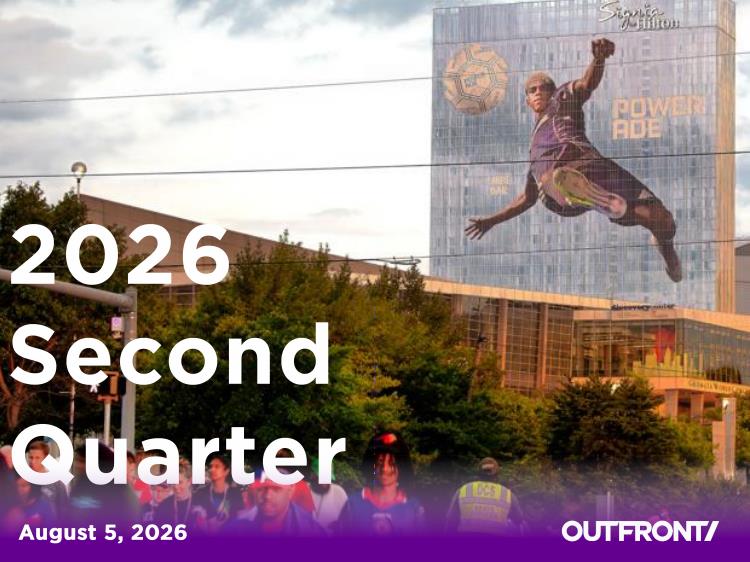
Q2 2026 Earnings Call Summary
The call presented strong operational momentum and robust top-line and adjusted OIBDA growth—driven by digital expansion, programmatic acceleration, and a successful World Cup—which management pairs with deliberate investments in data, programmatic sales, and sales tools to capture long-term enterprise opportunities. Near-term headwinds include rising SG&A and operating expenses tied to those investments, accounting treatment of MTA franchise costs, some one-time FIFA-related revenue that may not fully recur, and elevated leverage/interest cost dynamics. On balance, positives around revenue, margin expansion, digital/programmatic traction, and a healthy liquidity position outweigh the transitory and investment-driven challenges.
The company reiterated full‑year 2026 guidance: it now expects reported AFFO to grow in the low‑20% range versus 2025 AFFO of $338 million, expects full‑year CapEx of about $90 million (roughly $30–$35 million maintenance), plans to add ~125 digital boards in 2026 (51 added in Q2), and said Q3 revenue should be up high single‑digits year‑over‑year driven by roughly 20% transit growth and mid‑single‑digit billboard growth (including a $16 million World Cup benefit split ~$9M billboard / ~$7M transit in Q3); management also noted SG&A will likely grow faster than revenue for the remainder of 2026 due to strategic investments, interest expense included in guidance is about $145 million, committed liquidity is nearly $600 million (≈$30M cash, ≈$500M revolver, $50M AR facility), net leverage was ~4x (bottom of 4–5x target), the company refinanced with $500M notes due 2034 at 6.0%, and the Board raised the quarterly dividend 10% to $0.33 per share.
- Strong Consolidated Revenue GrowthConsolidated revenues increased 14% year-over-year, driven by 32% growth in transit and 8% growth in billboard.
- Substantial Profitability ImprovementConsolidated adjusted OIBDA rose 29% to $160 million in Q2.
- AFFO GrowthQ2 AFFO was $121 million, up 45% year-over-year; company now expects full-year 2026 reported AFFO to grow in the low-20% range versus 2025 AFFO of $338 million.
- World Cup / FIFA Revenue ContributionFIFA/World Cup activity generated about $35 million of revenue in the quarter (over $50 million overall), of which roughly half was believed to be incremental to typical business; estimated contribution to billboard ~$19 million and to transit ~$17 million in Q2.
- Exceptional Transit PerformanceTransit revenues grew 32% year-over-year (led by New York MTA which was up ~48% in the quarter); digital transit revenue rose nearly 36% to about $68 million; transit adjusted OIBDA improved by about $26 million to roughly $33 million.
- Digital Revenue Momentum and Programmatic GrowthCombined digital revenue grew over 23% and represented ~37% of total revenues (vs 34% prior year). Excluding an exited LA contract, digital would have grown ~26%. Programmatic and digital direct automated sales increased nearly 50% and represented 20% of total digital revenue (up from ~17%).
- Billboard Yield and Digital Billboard StrengthBillboard yield rose 12% year-over-year to $3.34k per month. Reported digital billboard revenues rose 17.6% (would be >21% excluding the exited LA contract); static billboard revenues up ~3.8% (4.3% ex-LA). Billboard adjusted OIBDA increased by over $13 million (10%).
- Capital Allocation and Balance Sheet ActionsQ2 CapEx was ~$17 million (including ~ $6 million maintenance); added 51 new digital boards and expects ~125 for full year. Committed liquidity nearly $600 million (cash ~$30 million, revolver ~$500 million, AR facility ~$50 million). Net total leverage around 4x (bottom of 4x–5x target). Refinanced $650M of 2027 notes with $500M 2034 notes at 6.0% and raised quarterly dividend 10% to $0.33 per share.
- Strategic Investments to Drive Future GrowthCompany accelerated investments in digital growth and data/measurement (hired a Chief Data Officer), reinforced programmatic sales, invested in sales and marketing tools (AI-enabled CRM, marketing cloud, AdQuick minority investment), and is expanding analytics to boost measurement and enterprise sales capability.
DE:76C0 Earnings History
| Report Date | Fiscal Quarter | Forecast / EPS | Last Year's EPS | EPS YoY Change | Press Release |
|---|---|---|---|---|---|
| Nov 05, 2026 | 2026 (Q3) | 0.35- | 0.26 | ― | ― |
| Aug 05, 2026 | 2026 (Q2) | 0.340.39 | 0.09 | 340.00% (+0.30) | |
| May 07, 2026 | 2026 (Q1) | 0.010.10 | -0.13 | 178.57% (+0.22) | |
| Feb 25, 2026 | 2025 (Q4) | 0.430.49 | 0.39 | 27.91% (+0.11) | |
| Nov 06, 2025 | 2025 (Q3) | 0.220.26 | 0.17 | 48.72% (+0.09) | |
| Aug 05, 2025 | 2025 (Q2) | 0.190.09 | 0.93 | -90.34% (-0.84) | |
| May 08, 2025 | 2025 (Q1) | -0.07-0.13 | -0.16 | 23.91% (+0.04) | |
| Feb 25, 2025 | 2024 (Q4) | 0.350.39 | 0.32 | 19.78% (+0.06) | |
| Nov 12, 2024 | 2024 (Q3) | 0.160.17 | 0.08 | 111.96% (+0.09) | |
| Aug 06, 2024 | 2024 (Q2) | 0.190.93 | -2.68 | 134.59% (+3.61) |
The table shows recent earnings report dates and whether the forecast was beat or missed. See the change in forecast and EPS from the previous year.
