


Atrium Mortgage Invest earnings date
Atrium Mortgage Invest (74O) Q3 2026 Earnings Report
DE:74O Q3 2026 EPS Results
- Actual EPS
- EUR 0.14
- Consensus EPS
- EUR 0.16
- Beat/Miss
- Missed by -EUR 0.02
- One Year Ago EPS
- EUR 0.16
DE:74O Q3 2026 Revenue Results
- Actual Revenue
- EUR 11.90M
- Expected Revenue
- EUR 12.18M
- Beat/Miss
- Missed by -EUR 286.63K
- YoY Revenue Growth
- -11.02%
Earnings Announcement Details
- Quarter
- Q3 2026
- Date
- 11/05/2026
- Time
- After Close
- Conference Call
- Thursday, November 5, 2026
Atrium Mortgage Invest's next earnings date is estimated for February 16, 2027, based on past reporting schedules.
Q3 2026 Earnings Call Audio
No earnings call audio is available for this earnings event.
Q3 2026 Earnings Slide Deck
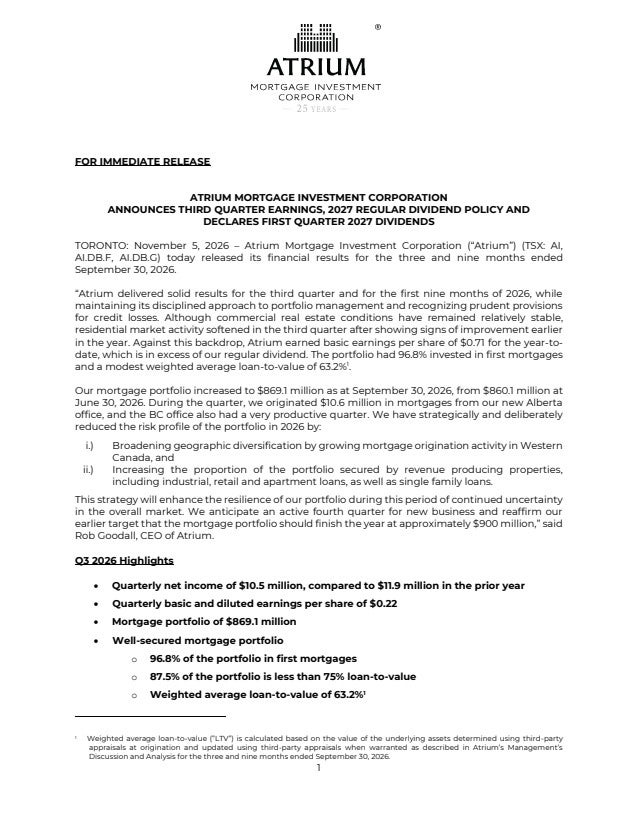
Q3 2026 Earnings Call Summary
The call was overall constructive and cautiously positive. Atrium reported lower year-over-year quarterly earnings and a materially higher credit-loss provision, while operating in weak residential markets and challenging employment conditions. However, these negatives were accompanied by quarter-over-quarter portfolio growth, improved Stage 2 and Stage 3 balances, strong portfolio security, lower borrowing costs, substantial credit-facility capacity, maintained dividends and expectations for strong Q4 originations and a $900 million year-end portfolio.
Management expects to have a strong quarter of loan originations in Q4, reach a portfolio of $900 million at year-end, and is forecasting up to $40 million of funded loans in B.C. in Q4 and over $80 million of new funded loans in calendar 2026; a large Alberta transaction is scheduled to close towards the end of Q4 or early Q1 and is probably in the $35 million range. New first mortgages are generally being priced in the 8% range, subordinate ranking mortgages are generally priced from 10% to 11% per annum, and all other mortgages that Atrium would be originating would support 8.64% or higher on a weighted average basis. Construction loans are not expected to represent more than 10% to 15% of the portfolio until market conditions improve, and Atrium’s long-term goal is having up to 40% of its portfolio located in Western Canada; the regular monthly dividend for 2027 will remain unchanged at $0.0775 per share or $0.93 per share annually.
- Positive Year-to-Date Earnings CoverageYear-to-date basic earnings were $0.71 per share, well above the year-to-date dividend of $0.6975 per share.
- Quarterly Portfolio GrowthThe mortgage portfolio increased 1% quarter-over-quarter to $869.1 million from $860.1 million, with net principal advances of $7.2 million as advances exceeded repayments during the quarter.
- Expected Q4 Origination MomentumManagement expects a strong quarter of loan originations in Q4 and continues to anticipate reaching a mortgage portfolio of $900 million at year-end.
- Expansion in Western CanadaThe British Columbia office contributed materially to new loan production over the last two quarters, with up to $40 million of funded loans forecast for Q4. The Alberta office funded its first $10 million of loans in Q3 and is working on a large transaction scheduled for late Q4 or early Q1. Management also anticipates that the B.C. office will achieve over $80 million of new funded loans in calendar 2026.
- Greater Focus on Preferred Lending SectorsAll new Q3 loans were commercial apartment or single-family loans. Commercial loans increased to 30.6% of the portfolio and apartment and single-family mortgages rose to 25.2%, bringing the combined exposure to 55.8% versus 53% in Q2 and 23% in 2023.
- Strong Portfolio Security ProfileFirst mortgages represented 96.8% of the mortgage portfolio. The average loan-to-value ratio was 63.2%, remaining within Atrium's desired range of 65%, and the total high-ratio loan balance was $108 million, or 12.5% of the portfolio.
- Improvement in Stage 2 and Stage 3 LoansStage 2 and Stage 3 loans declined materially to $133 million from $155 million quarter-over-quarter, representing 15.3% of the portfolio versus 18% previously. Stage 2 loans decreased to $72.4 million from $93.9 million, while Stage 3 loans declined slightly to $60.9 million from $61.5 million.
- Strong Credit Reserve CoverageThe total loan loss reserve increased to $31 million from $30.1 million in Q2 and represented 3.57% of the mortgage portfolio. Management said Atrium was well reserved on an overall basis.
- Lower Borrowing Costs and Available LiquidityTotal debt remained at 36% of total assets, with $231 million drawn on the $380 million credit facility. The weighted average borrowing cost was 4.68% for the quarter, down from 5.14% in the same quarter last year and 5.08% for full-year 2025.
- Stable Mortgage Portfolio RateThe weighted average mortgage rate declined only 5 basis points from 8.69% in Q2 to 8.64% at September 30, 2026, and management believes the average mortgage rate has stabilized. New first mortgages were generally priced in the 8% range, while subordinate-ranking mortgages were generally priced from 10% to 11% per annum.
- Floating-Rate Portfolio PositionAs of September 30, 2026, 80.9% of the mortgage portfolio was priced at floating interest rates, with the majority of loans having floors in place.
- Maintained DividendThe Board announced that the regular monthly dividend for 2027 would remain unchanged at $0.0775 per share, or $0.93 per share annually, and declared the same monthly dividend for January, February and March 2027.
- Construction Lending Remains ControlledConstruction loans increased to 6.7% of the portfolio following two recently funded construction loans. Management said it had become more comfortable with construction loans given the return of more stable construction costs, while expecting construction loans to remain below 10% to 15% of the portfolio until market conditions improve.
- Commercial Real Estate Market ResilienceCommercial real estate investment activity built momentum through most of Q3. The overall property capitalization rate moved 2 basis points lower despite a 62-basis-point increase in the 10-year bond yield.
- Strength in Industrial Real EstateThe national industrial availability rate dropped 30 basis points to 5.2%. Year-to-date national leasing was already ahead of full-year totals for each of the last three years, while availability rates were 5% in Toronto, 3.6% in Calgary, 4.9% in Edmonton and 5.8% in Vancouver.
- Low Apartment Vacancy Rates in Key MarketsApartment vacancy rates were 3.9% in Vancouver, 4.6% in Toronto, 5.5% in Edmonton and 5.9% in Calgary.
- Improvement in GTA New Home SalesGTA new home sales totaled 8,900 from January through September 2026, an increase of 122% compared with the same period in 2025. Low-rise sales increased 171% year-over-year to 6,600 and remained well above their 10-year average.
- Lower Future High-Rise Construction PipelineGTA condominium inventory under construction declined to 35,900 units, with completions forecast at 15,800 units in 2027, 12,000 in 2028 and 4,200 in 2029.
- Strong Alberta Relative Housing PerformanceAlthough September resales declined 2% in Calgary and 10% in Edmonton, management said the Alberta markets performed more strongly relative to their population sizes. Year-over-year benchmark prices increased 2.2% in Calgary and 2.9% in Edmonton.
DE:74O Earnings History
| Report Date | Fiscal Quarter | Forecast / EPS | Last Year's EPS | EPS YoY Change | Press Release |
|---|---|---|---|---|---|
| Feb 16, 2027 | 2026 (Q4) | 0.15- | 0.17 | ― | ― |
| Nov 05, 2026 | 2026 (Q3) | 0.160.14 | 0.16 | -12.00% (-0.02) | |
| Aug 05, 2026 | 2026 (Q2) | 0.160.15 | 0.17 | -11.11% (-0.02) | |
| May 07, 2026 | 2026 (Q1) | 0.170.16 | 0.16 | 0.00% (+0.00) | |
| Feb 26, 2026 | 2025 (Q4) | 0.170.17 | 0.17 | 0.00% (+0.00) | |
| Nov 12, 2025 | 2025 (Q3) | 0.170.16 | 0.17 | -3.85% (-0.01) | |
| Aug 07, 2025 | 2025 (Q2) | 0.150.17 | 0.17 | 3.85% (+0.01) | |
| May 13, 2025 | 2025 (Q1) | 0.160.16 | 0.17 | -7.41% (-0.01) | |
| Mar 06, 2025 | 2024 (Q4) | 0.150.17 | 0.17 | 0.00% (+0.00) | |
| Nov 13, 2024 | 2024 (Q3) | 0.160.17 | 0.16 | 4.00% (+0.01) |
The table shows recent earnings report dates and whether the forecast was beat or missed. See the change in forecast and EPS from the previous year.
