

HLS Therapeutics Inc (74D) Q2 2026 Earnings Report
DE:74D Q2 2026 EPS Results
- Actual EPS
- -EUR 0.03
- Consensus EPS
- -EUR 0.07
- Beat/Miss
- Beat by +EUR 0.04
- One Year Ago EPS
- -EUR 0.08
DE:74D Q2 2026 Revenue Results
- Actual Revenue
- EUR 13.01M
- Expected Revenue
- EUR 12.67M
- Beat/Miss
- Beat by +EUR 344.81K
- YoY Revenue Growth
- +3.51%
Earnings Announcement Details
- Quarter
- Q2 2026
- Date
- 08/12/2026
- Time
- Before Open
- Conference Call
- Wednesday, August 12, 2026
HLS Therapeutics Inc's next earnings date is estimated for November 12, 2026, based on past reporting schedules.
Q2 2026 Earnings Call Audio
No earnings call audio is available for this earnings event.
Q2 2026 Earnings Slide Deck
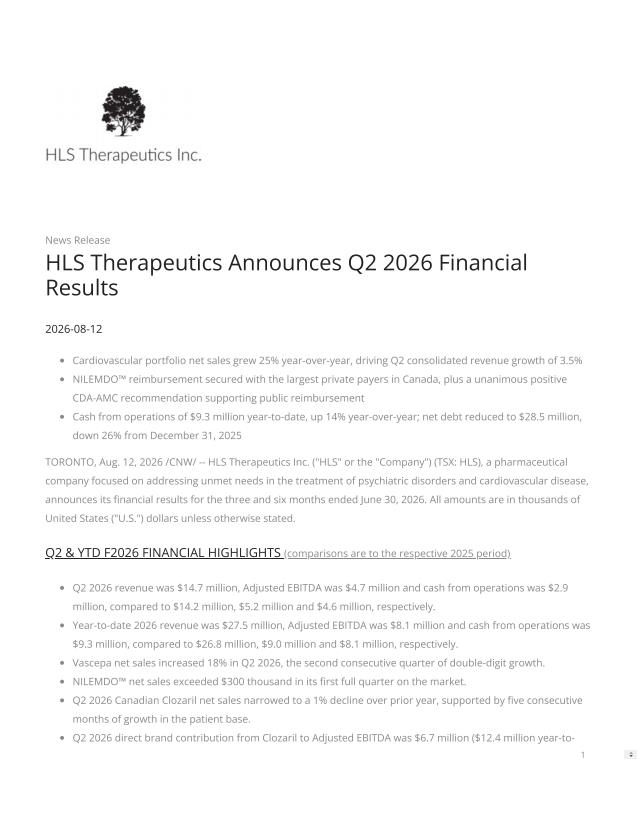
Q2 2026 Earnings Call Summary
The call conveyed an overall constructive outlook: the company demonstrated clear progress deleveraging the balance sheet, improving cash generation, and achieving strong early momentum in its cardiovascular franchise (notably Vascepa and Nilemdo) with meaningful payer wins and upcoming regulatory catalysts (NEXLIZET). Near-term profitability was pressured by launch investments (Nilemdo) and higher cost of sales and operating expenses, and U.S. Clozaril showed declines, but management reaffirmed 2026 guidance and expects margin improvement in the second half as revenue ramps. Net balance favors positive developments driven by durable CV growth and a stronger balance sheet, despite some short-term operational and margin headwinds.
HLS reaffirmed 2026 guidance of revenue $56.0–$60.0 million and adjusted EBITDA $18.5–$21.0 million, noting year‑over‑year adjusted EBITDA comparisons should improve in H2 as the cardiovascular portfolio ramps; Q2 revenue was $14.7M (+3.5% YoY) with the cardiovascular portfolio up ~25% (Vascepa net sales +18% in Q2, units +16%; Vascepa YTD net sales +14%, units +17%), Nilemdo generated >$300k in its first full quarter (≈1.2k NBRx by quarter end and ~80% private payer coverage), Clozaril Canada net sales were down ~1% while U.S. Clozaril was $3.0M (vs $3.5M prior year), Q2 adjusted EBITDA was $4.7M (≈10% below prior year), the cardiovascular direct brand contribution was breakeven for the year so far, YTD cash from operations was $9.3M (+14%), cash at quarter‑end was $13.7M, term loan principal was $42.2M (down 16% from end‑2025), net debt $28.5M (down 26% from end‑2025), and the company repurchased ~340k shares (C$1.4M) under an NCIB of up to 1.5M shares.
- Cardiovascular Portfolio AccelerationQ2 cardiovascular net sales grew 25% year over year (local and reporting currency), driving overall revenue momentum; company expects continued margin expansion from this portfolio in H2.
- Vascepa Sustained Double-Digit GrowthVascepa net sales increased 18% in Q2 and units grew 16%; year-to-date Vascepa net sales up 14% and units up 17%, reflecting expanding prescriber breadth and stable payer mix.
- Strong Early Launch Performance for NilemdoNilemdo completed its first full quarter with over $300k in net sales, ~1,200 new-to-brand prescriptions by end of Q2 (≈3.5x Vascepa at same launch point), weekly ex-factory run rate strengthened through the quarter, and private payer coverage reached ~80% of privately insured Canadians with most patients able to access as a full benefit without restrictions.
- Regulatory and Pipeline CatalystsNilemdo received a unanimous positive recommendation from Canada's drug agency for public reimbursement and will begin pCPA negotiations (targeting initial provincial listings in H1 2027); fixed-dose combo NEXLIZET is on track for a Health Canada decision by year end with launch planned for H1 2027.
- Clozaril Canada Stabilization and Patient GrowthBranded Clozaril patient base in Canada grew sequentially for five consecutive months through July; Canadian Clozaril net sales were down only 1% YoY (local currency) and the brand holds roughly a 50% market share with pockets of double-digit patient growth (e.g., BC).
- Improved Cash Generation and Lower Interest CostsYear-to-date cash from operations increased 14% to $9.3M (from $8.1M prior year); year-to-date interest expense fell to $1.3M from $3.1M, reflecting reduced debt and improved credit terms.
- Stronger Balance Sheet and Active Capital ReturnsCash at quarter-end was $13.7M (up $11.7M vs end of 2025); term loan principal reduced to $42.2M (down 16% vs end of 2025) and net debt $28.5M (down 26% vs end of 2025); launched NCIB for up to 1.5M shares and repurchased ~340k shares (~CAD 1.4M) through July 31.
- Reaffirmed 2026 GuidanceManagement reaffirmed full-year 2026 guidance of revenue $56M–$60M and adjusted EBITDA $18.5M–$21M, expecting improving adjusted EBITDA comps in H2 as cardiovascular revenue ramps.
DE:74D Earnings History
| Report Date | Fiscal Quarter | Forecast / EPS | Last Year's EPS | EPS YoY Change | Press Release |
|---|---|---|---|---|---|
| Nov 12, 2026 | 2026 (Q3) | -0.06- | -0.11 | ― | ― |
| Aug 12, 2026 | 2026 (Q2) | -0.07-0.03 | -0.08 | 66.67% (+0.05) | |
| Mar 12, 2026 | 2025 (Q4) | -0.03-0.04 | -0.09 | 60.00% (+0.05) | |
| Nov 13, 2025 | 2025 (Q3) | -0.06-0.11 | -0.13 | 20.00% (+0.03) | |
| Nov 13, 2025 | 2026 (Q1) | -0.11-0.06 | -0.13 | 50.00% (+0.06) | |
| Aug 14, 2025 | 2025 (Q2) | -0.07-0.08 | -0.16 | 50.00% (+0.08) | |
| May 08, 2025 | 2025 (Q1) | -0.11-0.13 | -0.17 | 26.32% (+0.04) | |
| Mar 13, 2025 | 2024 (Q4) | -0.08-0.09 | -0.15 | 41.18% (+0.06) | |
| Nov 07, 2024 | 2024 (Q3) | -0.11-0.13 | -0.19 | 28.57% (+0.05) | |
| Aug 08, 2024 | 2024 (Q2) | -0.14-0.16 | -0.26 | 37.93% (+0.10) |
The table shows recent earnings report dates and whether the forecast was beat or missed. See the change in forecast and EPS from the previous year.
