


Dream Industrl REIT earnings date
Dream Industrl REIT (6MS) Q3 2026 Earnings Report
DE:6MS Q3 2026 EPS Results
- Actual EPS
- EUR 0.14
- Consensus EPS
- ―
- Beat/Miss
- ―
- One Year Ago EPS
- EUR 0.10
DE:6MS Q3 2026 Revenue Results
- Actual Revenue
- EUR 83.48M
- Expected Revenue
- EUR 86.77M
- Beat/Miss
- Missed by -EUR 3.28M
- YoY Revenue Growth
- +3.50%
Earnings Announcement Details
- Quarter
- Q3 2026
- Date
- 11/03/2026
- Time
- After Close
- Conference Call
- Tuesday, November 3, 2026
Dream Industrl REIT's next earnings date is estimated for February 16, 2027, based on past reporting schedules.
Q3 2026 Earnings Call Audio
No earnings call audio is available for this earnings event.
Q3 2026 Earnings Slide Deck
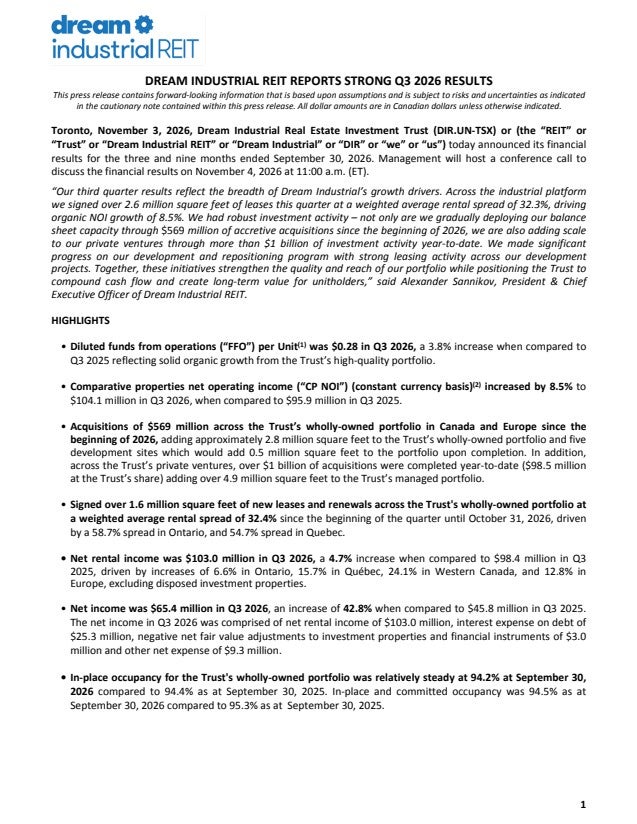
Q3 2026 Earnings Call Summary
The call was broadly constructive. The REIT reported solid NOI, FFO, leasing, occupancy, acquisition, private-venture, liquidity, and development progress, while reiterating full-year guidance at the stronger end of its ranges. These positives were tempered by higher refinancing costs, macroeconomic and trade uncertainty, a tenant in CCAA protection, slower-than-desired power procurement progress, selected occupancy and market challenges, and elevated construction costs. Overall, the highlights significantly outweighed the lowlights.
Dream Industrial REIT expects net property management margin to exceed $16 million annually on a run rate basis by year-end 2026, or 40% growth compared to 2025; an unlevered yield on cost of approximately 8% on the wholly owned projects upon stabilization; and small to mid-bay developments at an unlevered yield on cost in the 7% to 7.5% range. For full year 2026, it expects average in-place occupancy to be above 94%, full year comparative properties NOI growth on the higher end of the 7% to 8% range, and full year FFO per unit to be slightly above the midpoint of the $1.08 to $1.10 range. It expects leverage to remain in the high 30% range and net debt to EBITDA in the mid-7x range, trending lower, retention to be drifting towards long-term average of 70% to 75% over the next couple of years, and occupancy to move up to the upper end of the long-term average range of 95%, 96%; it also expects approximately 100% re-leasing spreads on the GTA asset, 6 to 9 months as a good average lease-up time frame, and debt issuance typically in the 3- to 5-year term, with 5-year terms in the low to mid-4s, like 4.40% to 4.50% range on 5-year terms.
- Strong Comparative Properties NOI and FFO GrowthThird-quarter comparative properties NOI grew 8.5% year over year, driven by healthy leasing activity and strong rental spreads, particularly in Canada. Diluted FFO was $0.28 per unit, up 3.8% from the prior-year quarter, while year-to-date FFO per unit was $0.81, up 4.6%.
- Canadian and European Portfolio NOI GrowthYear-to-date comparative properties NOI growth was 11.9% in Canada and 4.5% in Europe. Western Canada led regional performance with 19.8% growth, Quebec grew 17.6%, and Ontario grew 6%.
- Robust Leasing Spreads and VolumeThrough the end of October, the wholly owned portfolio transacted 4.6 million square feet of leases at a weighted average spread of 22.9%, including 1.7 million square feet of new leasing. Since the start of the third quarter, nearly 1.6 million square feet was leased at a 32.4% weighted average spread, led by 59% in Ontario and 55% in Quebec. Across the broader platform, approximately 8.1 million square feet of leasing was executed.
- Higher Occupancy and Strong Regional FundamentalsCanadian in-place occupancy was 95.5% at quarter end, 200 basis points higher than a year ago, driven by leasing in Quebec and a recently completed Alberta development. Western Canada had record-low vacancy, while the GTA experienced solid absorption, lower incentives, and limited expected supply over the next 12 months.
- Large Quebec Lease Backfill at More Than Double Prior RentIn Quebec, the REIT backfilled 181,000 square feet through an early termination with a new four-year lease at more than double the previous rents and with no downtime.
- Positive European Leasing and Rent GrowthEuropean small- to mid-bay fundamentals remained strong, with healthy absorption and rent growth in the U.K. and the Netherlands, meaningful rent growth in Spain and certain German markets, and renewed demand for large blocks of space. A 250,000-square-foot German vacancy was leased, with the lease expected to commence in December 2026.
- Inflation Indexation Across European PortfolioMore than 85% of the European portfolio is indexed to CPI, allowing rents to increase in line with inflation. Management noted that in-place European rents increased in the low double-digit range during 2022 and 2023 in line with inflation.
- Significant Acquisition ActivitySince the beginning of the year, the REIT completed $569 million of acquisitions across its wholly owned portfolio, adding more than 2.7 million square feet of urban small- and mid-bay assets in Canada and Europe, plus five development sites expected to add approximately 0.5 million square feet upon completion. Excluding Chancerygate, the acquisitions had an approximately 6% going-in yield and approximately 7% mark-to-market yield.
- Chancerygate Entry into U.K. Multi-Let IndustrialThe August Chancerygate transaction marked the REIT's entry into the U.K. multi-let industrial sector. Leasing at the development projects was tracking in line with plan, with an expected unlevered yield on cost of approximately 8% on wholly owned projects upon stabilization. The platform has a pipeline of small- to mid-bay developments with unlevered yields on cost in the 7% to 7.5% range.
- Private Venture ExpansionThe Dream Summit JV acquired a 15-building, 1.5 million-square-foot portfolio in Edmonton, and the DCI JV subsequently acquired a 2.1 million-square-foot portfolio of high-quality logistics assets in the GTA. The combined purchase price was just over $800 million at an approximately 6% going-in cap rate, with upside as leases are marked to market.
- Growth in Property Management IncomeNet property management and other income was $3.3 million for the quarter, up 29% year over year, reflecting the growing scale of the private venture business. Net property management margin is expected to exceed $16 million annually on a run-rate basis by year-end 2026, representing 40% growth compared with 2025.
- Progress on Power Procurement StrategyThe REIT made meaningful progress at two sites and was in advanced negotiations for binding commitments for near-term power delivery totaling approximately 100 megawatts. Just under 50% of the capacity was for a private venture site and the remainder for a wholly owned property. The sites are being marketed to users with a focus on powered-shell delivery.
- Development Leasing MomentumThe Whitby redevelopment in the GTA was approximately 50% leased, with a further 33% under conditional lease agreements, and the REIT was in advanced negotiations for the remaining space. Chancerygate's West Sussex site was one-third leased with a pipeline expected to take it to two-thirds, while two other advanced sites were expected to enter lease-up through late 2026 and early 2027.
- Disciplined Development EconomicsChancerygate multi-tenant small-bay assets were expected to have average lease-up periods of six to nine months. Management said European small-bay developments were being sourced at yields on cost between 7% and 8%, with additional pipeline opportunities in the 7% to 7.5% range.
- Strong Balance Sheet LiquidityThe REIT issued $300 million of Series I unsecured debentures maturing in 2030, swapped the proceeds to euros, fixed the interest rate on two-thirds of the proceeds, and achieved an average rate of 4.05% on the total swapped proceeds. Pro forma liquidity was approximately $640 million, positioning the REIT to address the $250 million Series D debentures due in December 2026 and fund development and solar programs.
- Leverage Expected to Trend LowerQuarter-end leverage was 38.5% and net debt-to-EBITDA was 7.3x. Management expects leverage to remain in the high 30% range and net debt-to-EBITDA in the mid-7x range, trending lower as near-term developments, including Chancerygate projects, stabilize.
- Outlook Reiterated at Strong End of RangesThe REIT reiterated its full-year 2026 outlook, including average in-place occupancy above 94%, full-year comparative properties NOI growth at the higher end of the previously communicated 7% to 8% range, and FFO per unit slightly above the midpoint of the $1.08 to $1.10 range.
- Distribution Increase and Payout CoverageThe FFO payout ratio was 64.3% for the quarter. A 2.5% distribution increase took effect with the September 15 distribution, bringing the annualized distribution rate to $0.7175 per unit.
- Positive Leasing Outlook into 2027 and 2028Management expects positive re-leasing spreads in 2027 and said the vast majority of 2028 leases also have positive re-leasing spreads. Contractual escalators were hovering around 3% in Canada and were consistently tied to inflation in Europe.
- Active Demand from Diverse Occupier GroupsRFP activity was strong in September and October without signs of slowing. Demand was predominantly from defense, manufacturing, and Asian third-party logistics providers, while government spending was supporting demand for power-equipped space.
- Limited Speculative SupplySpeculative supply was below 1% of national inventory, which management said was contributing to constructive industrial fundamentals.
- Tenant Watch List Remains ManageableManagement stated that there was nothing of significance on the tenant watch list and nothing noteworthy in Ontario, Quebec, or Europe.
DE:6MS Earnings History
| Report Date | Fiscal Quarter | Forecast / EPS | Last Year's EPS | EPS YoY Change | Press Release |
|---|---|---|---|---|---|
| Feb 16, 2027 | 2026 (Q4) | ―- | 0.06 | ― | ― |
| Nov 03, 2026 | 2026 (Q3) | ―0.14 | 0.1 | 44.59% (+0.04) | |
| Aug 04, 2026 | 2026 (Q2) | ―0.06 | 0.1 | -35.63% (-0.04) | |
| May 05, 2026 | 2026 (Q1) | ―0.14 | 0.1 | 31.90% (+0.03) | |
| Feb 17, 2026 | 2025 (Q4) | ―0.06 | 0.24 | -72.68% (-0.17) | |
| Nov 04, 2025 | 2025 (Q3) | ―0.10 | 0.03 | 227.08% (+0.07) | |
| Aug 05, 2025 | 2025 (Q2) | ―0.10 | 0.14 | -25.23% (-0.03) | |
| May 06, 2025 | 2025 (Q1) | ―0.10 | 0.16 | -37.31% (-0.06) | |
| Feb 18, 2025 | 2024 (Q4) | ―0.24 | -0.02 | 1316.13% (+0.26) | |
| Nov 05, 2024 | 2024 (Q3) | ―0.03 | 0.11 | -73.18% (-0.08) |
The table shows recent earnings report dates and whether the forecast was beat or missed. See the change in forecast and EPS from the previous year.
