

Alaris Royalty (5UK) Q2 2026 Earnings Report
DE:5UK Q2 2026 EPS Results
- Actual EPS
- EUR 0.59
- Consensus EPS
- EUR 0.29
- Beat/Miss
- Beat by +EUR 0.30
- One Year Ago EPS
- -EUR 0.25
DE:5UK Q2 2026 Revenue Results
- Actual Revenue
- EUR 40.31M
- Expected Revenue
- EUR 28.02M
- Beat/Miss
- Beat by +EUR 12.28M
- YoY Revenue Growth
- +23.55%
Earnings Announcement Details
- Quarter
- Q2 2026
- Date
- 08/06/2026
- Time
- After Close
- Conference Call
- Thursday, August 6, 2026
Alaris Royalty's next earnings date is estimated for November 3, 2026, based on past reporting schedules.
Q2 2026 Earnings Call Audio
No earnings call audio is available for this earnings event.
Q2 2026 Earnings Slide Deck
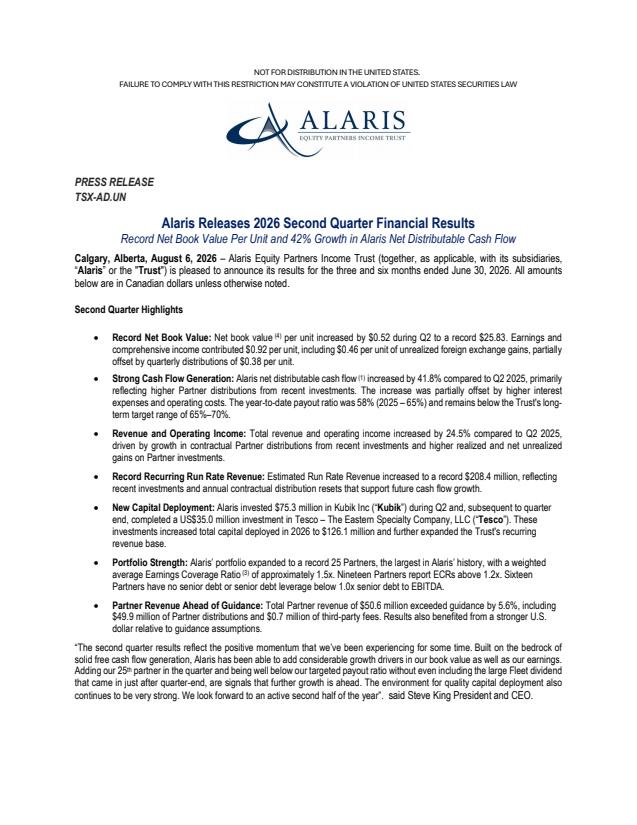
Q2 2026 Earnings Call Summary
The call conveyed strong operational and financial momentum: revenue, operating income, preferred distributions, distributable cash flow, net book value per unit, and fair value gains all showed meaningful improvement. Management has actively deployed capital ($126M YTD) and expanded the portfolio to a record 25 partners while maintaining liquidity ($127M undrawn) and a payout ratio below targets. Offsetting these positives are timing variability in common distributions, some partner‑specific softness (regional/construction exposure, one weather‑impacted partner), intermittent payment and covenant pressure at GWM, FX‑driven volatility in reported earnings, and the potential need for additional funding if deployment accelerates further. On balance, the highlights substantially outweigh the lowlights.
The company guided to Q3 partner revenue of approximately $69 million and raised its next‑12‑month estimate run‑rate revenue to about $208 million (up from $200M at year‑end and $203M at Q1, roughly 14% above the $183M estimate a year ago), while noting pro forma payout of ~59% and a forward run‑rate payout range of 60%–65% (comfortably below the long‑term 65%–70% target); it finished the quarter with $127 million of undrawn credit capacity, has deployed $126 million of capital YTD (including $75M into Kubik and a subsequent USD35M into Tesco) and expanded to a record 25 partners, reported Q2 partner revenue of $50.6M (5.6% ahead of guidance), Q2 net distributable cash flow +42% YoY and +21% YTD, preferred distributions annualized yield 12.8% (from 12.2% a year ago), net book value per unit $25.83 (up $0.52 in the quarter, $1.04 YTD), a weighted average ECR ~1.5x with 84% of contractual preferred distributions from partners >1.2x coverage and 16 of 25 partners with senior debt ≤1x EBITDA; management also noted common dividends included in the run‑rate of roughly $25M for the remainder of 2026 (dropping to ~$16–17M on a conservative TTM forward into 2027).
- Partner Revenue and Guidance BeatTotal partner revenue of $50.6 million in Q2, 5.6% ahead of guidance (including $49.9M of partner distributions and $0.7M of third‑party fees).
- Strong Year‑over‑Year Revenue and Distribution GrowthTotal revenue and operating income rose 25% versus Q2 last year; partner distribution revenue increased nearly 20% YoY. On a year‑to‑date basis, total revenue and operating income were up 13% and partner distribution revenue up 15%.
- Preferred Distributions and Yield ImprovementPreferred distributions increased 24% in the quarter and 17% year‑to‑date; the annualized yield on preferred capital rose to 12.8% from 12.2% a year ago.
- Distributable Cash Flow AccelerationNet distributable cash flow increased 42% compared to Q2 last year and was up 21% for the first six months of the year. Six‑month payout ratio improved to 58% from 65% a year earlier; pro forma payout ratio remains ~59% (below long‑term 65%–70% target).
- Record Net Book Value and Fair Value GainsNet book value per unit increased $0.52 in Q2 to a record $25.83 (up $1.04 YTD). The company recorded $10.8M of net unrealized fair value gains in the quarter (Fleet contributed USD 8.1M Q2 and >USD 18M YTD) and realized $4.9M of gains through partial redemptions YTD.
- Active Capital Deployment and Portfolio ExpansionCompleted $75M investment in Kubik during the quarter and subsequent USD 35M investment in Tesco; total capital deployed in 2026 reached $126M and the portfolio expanded to a record 25 partners.
- Improved Run‑Rate and LiquidityEstimated 12‑month run‑rate revenue increased to ~$208M (up from $200M at year‑end and $203M at Q1; ~14% above $183M a year ago). Company ended the quarter with $127M of undrawn credit facility capacity.
- Notable Partner Performance (Fleet)Fleet paid a USD 13.8M common distribution in July (post‑quarter). Fleet has paid over USD 50M of common dividends on an $8M investment, illustrating potential upside from common equity holdings.
DE:5UK Earnings History
| Report Date | Fiscal Quarter | Forecast / EPS | Last Year's EPS | EPS YoY Change | Press Release |
|---|---|---|---|---|---|
| Nov 03, 2026 | 2026 (Q3) | 0.44- | 1.13 | ― | ― |
| Aug 06, 2026 | 2026 (Q2) | 0.290.59 | -0.25 | 332.99% (+0.84) | |
| May 06, 2026 | 2026 (Q1) | 0.270.57 | 0.32 | 78.20% (+0.25) | |
| Mar 09, 2026 | 2025 (Q4) | 0.21-0.00 | 1.1 | -100.23% (-1.10) | |
| Nov 05, 2025 | 2025 (Q3) | 0.531.13 | 0.72 | 56.86% (+0.41) | |
| Aug 07, 2025 | 2025 (Q2) | -0.00-0.25 | 0.44 | -157.10% (-0.69) | |
| May 08, 2025 | 2025 (Q1) | 0.310.32 | 0.97 | -67.11% (-0.65) | |
| Mar 10, 2025 | 2024 (Q4) | 0.381.10 | 0.55 | 99.07% (+0.55) | |
| Nov 05, 2024 | 2024 (Q3) | 0.330.72 | 0.84 | -14.35% (-0.12) | |
| Aug 01, 2024 | 2024 (Q2) | 0.270.44 | 0.39 | 13.11% (+0.05) |
The table shows recent earnings report dates and whether the forecast was beat or missed. See the change in forecast and EPS from the previous year.