


IHS Holding earnings date
IHS Holding (4JB) Q3 2025 Earnings Report
DE:4JB Q3 2025 EPS Results
- Actual EPS
- EUR 0.40
- Consensus EPS
- EUR 0.09
- Beat/Miss
- Beat by +EUR 0.31
- One Year Ago EPS
- -EUR 0.55
DE:4JB Q3 2025 Revenue Results
- Actual Revenue
- EUR 412.89M
- Expected Revenue
- EUR 384.76M
- Beat/Miss
- Beat by +EUR 28.13M
- YoY Revenue Growth
- +8.28%
Earnings Announcement Details
- Quarter
- Q3 2025
- Date
- 11/12/2025
- Time
- Before Open
- Conference Call
- Wednesday, November 12, 2025
IHS Holding's next earnings date is estimated for March 16, 2027, based on past reporting schedules.
Q3 2025 Earnings Call Audio
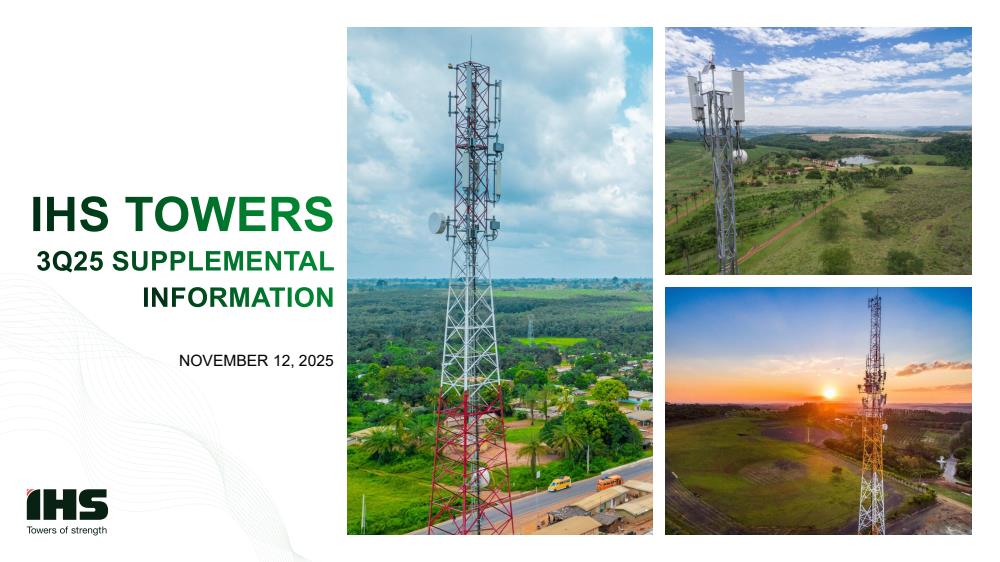
Q3 2025 Earnings Slide Deck
Q3 2025 Earnings Call Summary
The earnings call presented a generally positive outlook with strong revenue and growth metrics, increased profitability, and successful deleveraging efforts. Expansion in Brazil and favorable macroeconomic conditions in key markets further bolster the positive sentiment. However, there were challenges such as tenancy churn and increased costs that slightly tempered the overall positive outlook.
During the IHS Holding Limited third quarter 2025 earnings call, the company reported robust performance across key metrics, including a revenue of $455 million, a 9% constant currency revenue growth, and an adjusted EBITDA of $261 million with a margin of 57.5%. The adjusted leverage free cash flow (ALFCF) was $158 million, reflecting an 81% increase year-on-year. The total capital expenditure (CapEx) amounted to $77 million, up 16% from the previous year. The company's consolidated net leverage ratio improved to 3.3 times, down 0.6x year-on-year. IHS raised its full-year 2025 outlook, projecting revenue between $1.72 to $1.75 billion, adjusted EBITDA between $995 million to $1.015 billion, and ALFCF in the range of $400 million to $420 million. The company highlighted strong macroeconomic conditions in key markets like Nigeria and Brazil, driving organic growth and profitability.
- Strong Revenue and GrowthRevenue for Q3 2025 came in at $455 million, with constant currency revenue growth of almost 9% driven by CPI escalators, colocation lease amendments, and new sites.
- Increased Adjusted EBITDAAdjusted EBITDA was $261 million with a margin of 57.5%, an increase of over 6% reflecting ongoing commitment to cost control and driving profitability.
- Significant ALFCF GrowthAdjusted Leverage Free Cash Flow (ALFCF) increased by more than 80% year on year to $158 million.
- Deleveraging SuccessConsolidated net leverage ratio reduced to 3.3 times, down 0.6x year on year, supported by the initial $175 million proceeds from the Rwanda disposal.
- Brazil Market ExpansionExpanded partnership with TIM in Brazil, planning to build up to 3,000 new sites, highlighting significant growth potential in the LATAM segment.
- Positive Macroeconomic Trends in Key MarketsEncouraging trends in Nigeria with naira appreciation and in Brazil with currency strength and high telecom sector growth.
DE:4JB Earnings History
| Report Date | Fiscal Quarter | Forecast / EPS | Last Year's EPS | EPS YoY Change | Press Release |
|---|---|---|---|---|---|
| Mar 16, 2027 | 2026 (Q4) | 0.25- | -0.21 | ― | ― |
| Nov 10, 2026 | 2026 (Q3) | 0.270.07 | 0.4 | -81.82% (-0.33) | |
| Aug 11, 2026 | 2026 (Q2) | 0.11-0.04 | 0.09 | -140.00% (-0.13) | |
| May 12, 2026 | 2026 (Q1) | 0.290.18 | 0.09 | 100.00% (+0.09) | |
| Mar 16, 2026 | 2025 (Q4) | 0.09-0.21 | 0.66 | -131.51% (-0.87) | |
| Nov 12, 2025 | 2025 (Q3) | 0.090.40 | -0.55 | 172.13% (+0.95) | |
| Aug 12, 2025 | 2025 (Q2) | 0.040.09 | -0.33 | 127.78% (+0.42) | |
| May 20, 2025 | 2025 (Q1) | 0.120.09 | -4.24 | 102.14% (+4.33) | |
| Mar 18, 2025 | 2024 (Q4) | 0.010.66 | -1.23 | 153.68% (+1.90) | |
| Nov 12, 2024 | 2024 (Q3) | 0.07-0.55 | -0.72 | 22.78% (+0.16) |
The table shows recent earnings report dates and whether the forecast was beat or missed. See the change in forecast and EPS from the previous year.
