

Navios Maritime Partners (3PXA) Q2 2026 Earnings Report
DE:3PXA Q2 2026 EPS Results
- Actual EPS
- EUR 4.16
- Consensus EPS
- EUR 3.89
- Beat/Miss
- Beat by +EUR 0.27
- One Year Ago EPS
- EUR 1.92
DE:3PXA Q2 2026 Revenue Results
- Actual Revenue
- EUR 366.73M
- Expected Revenue
- EUR 322.62M
- Beat/Miss
- Beat by +EUR 44.11M
- YoY Revenue Growth
- +25.22%
Earnings Announcement Details
- Quarter
- Q2 2026
- Date
- 08/20/2026
- Time
- Before Open
- Conference Call
- Thursday, August 20, 2026
Navios Maritime Partners's next earnings date is estimated for November 4, 2026, based on past reporting schedules.
Q2 2026 Earnings Call Audio
Q2 2026 Earnings Slide Deck
Q2 2026 Earnings Call Summary
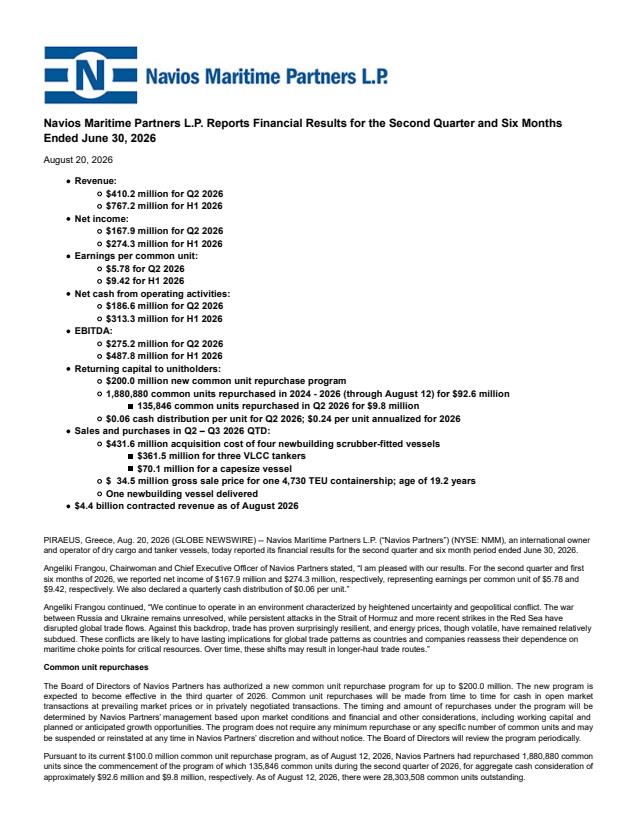
The call emphasized strong operational and financial progress: double-digit revenue and TCE growth, record $4.4B contracted backlog, significant fleet modernization, improved liquidity and meaningful capital returned to unitholders via a doubled $200M buyback. These positives are balanced against notable external risks — geopolitical disruptions (Hormuz/Red Sea), higher insurance/voyage costs, ongoing newbuilding capital commitments (~$290M equity remaining) and leverage that remains above the 20%–25% target (net LTV 27.9%). Management presented clear mitigation actions (long-term charters, diversified financing, debt-free vessel buffer) and strong cash flow visibility, indicating resilience but also signaling items to monitor (insurance costs, delivery-related funding, spot exposure). Overall the updates and metrics point to materially more positive than negative developments for Navios Partners in the near-to-medium term.
Management's guidance emphasized strong cash‑flow visibility and continued deleveraging: Q2 revenue $410.2M, EBITDA $275.2M (adjusted EBITDA $242M), net income $167.9M (adjusted $135M) and EPS $5.78 (adjusted $4.65); H1 revenue $767M and adjusted EBITDA $446M; combined TCEs $28,512/day in Q2 ($27,098/day H1) with bulk $23,682/day, tankers $33,159/day and containers ≈$31,191/day. The 176‑vessel fleet (avg age 8.7 yrs vs industry 13.7; tankers avg 5 yrs) underpins a $4.4B contracted backlog through 2037 and secured ~$922M tanker (14 vessels, ~5‑yr avg), $125M dry bulk (4 vessels, ~3 yrs) and $194M container (6 vessels, ~3 yrs) contracted revenue; 29 newbuilds (~$2.5B) deliver through 2029 with ~$290M equity remaining, in‑water net vessel equity $4.8B and total fleet value $10.2B. Balance‑sheet and operational metrics: liquidity $625M (cash $469M + $156M RCF), long‑term borrowings ≈$2.26B, net LTV 27.9% (target 20–25%), net debt/book cap 30.6%, 53,546 available days (88% fixed), 6,250 open/index‑linked days in 2026, 77% of remaining days fixed at $28,100/day, H2 contracted revenue exceeds projected cash operating cost by ~$151M; capital return includes a $0.06/unit distribution and a new $200M buyback (1.9M units repurchased for $92.6M to date, common units down ~6% to 28.3M).
- Strong Revenue and TCE GrowthQ2 2026 total revenue of $410.2M, up 25% YoY (Q2 2025: $328M). Combined TCE rate for Q2 2026 increased 24% to $28,512/day. First half 2026 revenue $767M, up 21% YoY; combined H1 TCE up 22% to $27,098/day.
- Robust Profitability and EarningsReported Q2 net income $167.9M and EBITDA $275.2M. Adjusted EBITDA for Q2 increased by $70M to $242M; adjusted net income for Q2 increased by $71M to $135M. Earnings per common unit Q2 $5.78 and H1 $9.42.
- Record Contracted Revenue Backlog and VisibilityContracted revenue backlog reached a record high of $4.4B (extended through 2037). Over the past 5 years contracted revenue grew by more than 30%. Tankers ~$2.0B, containerships ~$2.1B, dry bulk ~$0.3B.
- Fleet Modernization and Competitive Age ProfileFleet average age 8.7 years vs industry average 13.7 years; tanker fleet average age 5 years. Company highlighted fleet modernization resulting in a materially younger fleet (presentation noted ~40% younger than industry average). Fleet value (incl. newbuild program) $10.2B; in‑water net vessel equity $4.8B.
- VLCC and Newbuilding Transactions Providing Long-Term Cash FlowSold two 16-year VLCCs for $136.5M and acquired 7 newbuilding VLCCs for $844M (one subject to discussions). Period charters average 6.1 years at an average net daily rate of $45,224 for the VLCCs; associated charters expected to generate ~ $700M of revenue and materially reduce residual value exposure.
- Liquidity, Balance Sheet Strength and Deleveraging ProgressAvailable liquidity $625M (cash + revolvers). Net LTV improved to 27.9% (reduced 38% over the deleveraging program) and net debt to book capitalization improved to 30.6%. 55 debt-free vessels representing $1.9B of debt-free vessel value. Diversified financing, 43% fixed-rate debt.
- Capital Return to Unitholders and Unit Repurchase ProgramAnnounced a new $200M common unit repurchase authorization (double prior program). Since 2Q 2024 repurchased 1.9M units for $92.6M; common units outstanding declined ~6% to 28.3M, program generated ~$6.30 per unit of accretion. Returned $46M of capital in last 12 months ($6M distributions + $40M repurchases).
- Contracted Revenue Exceeds Operating Costs for 2H 2026For 2H 2026 contracted revenue exceeds projected cash operating costs by $151.2M. Company has 6,250 open or index-linked days in 2026 preserving upside while maintaining contracted earnings.
DE:3PXA Earnings History
| Report Date | Fiscal Quarter | Forecast / EPS | Last Year's EPS | EPS YoY Change | Press Release |
|---|---|---|---|---|---|
| Nov 04, 2026 | 2026 (Q3) | 4.12- | 2.53 | ― | ― |
| Aug 20, 2026 | 2026 (Q2) | 3.894.16 | 1.92 | 116.28% (+2.24) | |
| May 21, 2026 | 2026 (Q1) | 2.483.00 | 1.41 | 112.03% (+1.58) | |
| Feb 19, 2026 | 2025 (Q4) | 2.133.04 | 2.33 | 30.27% (+0.71) | |
| Nov 18, 2025 | 2025 (Q3) | 2.272.53 | 2.82 | -10.16% (-0.29) | |
| Aug 21, 2025 | 2025 (Q2) | 1.581.92 | 2.74 | -29.74% (-0.81) | |
| May 07, 2025 | 2025 (Q1) | 1.271.41 | 2.07 | -31.90% (-0.66) | |
| Feb 13, 2025 | 2024 (Q4) | 2.422.33 | 3.86 | -39.58% (-1.53) | |
| Nov 05, 2024 | 2024 (Q3) | 2.982.82 | 2.4 | 17.54% (+0.42) | |
| Aug 20, 2024 | 2024 (Q2) | 2.542.74 | 2.97 | -7.83% (-0.23) |
The table shows recent earnings report dates and whether the forecast was beat or missed. See the change in forecast and EPS from the previous year.
