

CNH Industrial (37C) Q2 2026 Earnings Report
DE:37C Q2 2026 EPS Results
- Actual EPS
- EUR 0.12
- Consensus EPS
- EUR 0.09
- Beat/Miss
- Beat by +EUR 0.02
- One Year Ago EPS
- EUR 0.15
DE:37C Q2 2026 Revenue Results
- Actual Revenue
- EUR 4.29B
- Expected Revenue
- EUR 4.26B
- Beat/Miss
- Beat by +EUR 29.87M
- YoY Revenue Growth
- +1.95%
Earnings Announcement Details
- Quarter
- Q2 2026
- Date
- 08/03/2026
- Time
- Before Open
- Conference Call
- Monday, August 3, 2026
CNH Industrial's next earnings date is estimated for November 9, 2026, based on past reporting schedules.
Q2 2026 Earnings Call Audio
Q2 2026 Earnings Slide Deck
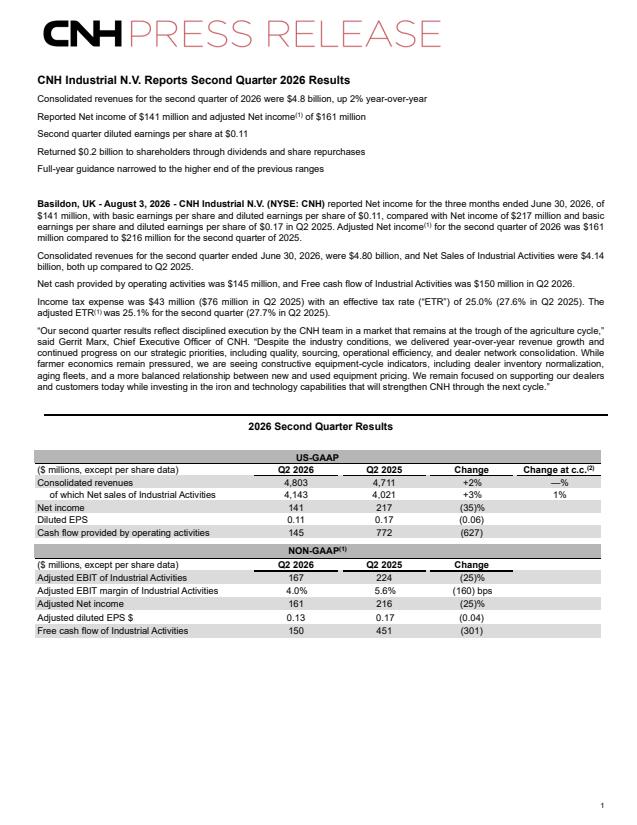
Q2 2026 Earnings Call Summary
The call presented a mixed picture: modest revenue growth and notable Construction strength, disciplined operational progress (procurement, dealer consolidation, pricing positive vs. cost), and improved guidance in some areas, but these positives are offset by significant margin compression from tariffs and product mix, sharp weakness in South America, H1 negative industrial free cash flow, and constrained farm economics. Management highlighted concrete strategic actions and potential tailwinds (underproduction correction, tariff rate reductions, sourcing savings), but material near-term demand and profitability headwinds remain.
Management updated 2026 guidance with Agriculture net sales now expected to be about flat year‑over‑year (including ~2% favorable currency) with positive pricing of 1.5–2% and Agriculture adjusted EBIT margin narrowed to 5.0–5.5%; Construction net sales raised to +5–10% (including ~2% currency and ~1% pricing) with Construction EBIT margin 1.8–2.3%; Industrial net sales are forecast flat to +2% with Industrial adjusted EBIT margin 3.2–3.8%, Industrial free cash flow of $200–$400 million, and adjusted EPS narrowed to $0.41–$0.46. Q3 color: Agriculture sales and EBIT about flat YoY; Construction sales expected up low‑to‑mid teens with EBIT in the low‑to‑mid single digits; dealer inventories targeted to be reduced by $400–$500 million by year‑end. Recent Q2 results (not included in the full‑year outlook for refunds) were consolidated revenues $4.8 billion (+2% YoY), Agriculture sales ~$3.3 billion (+1%), Construction sales $866 million (+12%), Q2 adjusted net income $161 million (EPS $0.13), industrial free cash flow $150 million, Financial Services retail originations $2.5 billion, managed portfolio $28 billion and delinquencies of 4.4%. Guidance excludes additional IEEPA tariff refunds beyond the $5 million received in Q2 (Phase 2 claims ~ $135 million, Phase 3 ~ $15 million) and reflects updated Section 232 tariff impacts (~170 bps headwind in Ag, ~470 bps in Construction) with Q3 tariffs ~flat YoY and Q4 slightly lower.
- Consolidated Revenue GrowthConsolidated revenues of $4.8 billion, up 2% year-over-year (including ~2% positive currency impact).
- Agriculture Sales Resilience with Regional StrengthsAgriculture net sales of ~$3.3 billion, up 1% year-over-year; North America up ~10%, EMEA roughly flat (+1%), while South America declined sharply.
- Construction Segment OutperformanceConstruction net sales of $866 million, up 12% year-over-year driven by North America; guidance for Construction raised to +5% to +10% sales and EBIT margin guidance to 1.8%–2.3%.
- Adjusted Profit and EPSAdjusted net income of $161 million and adjusted EPS of $0.13 for the quarter; full-year adjusted EPS guidance narrowed to $0.41–$0.46.
- Positive Price/Cost DynamicsPrice/cost remained positive for the quarter and is expected to be positive for the full year, helping offset some headwinds.
- Progress on Dealer Consolidation and Market ShareOngoing dealer consolidation and multi-brand dealer expansion (examples cited across US, Germany, Brazil) with reported market share gains across tractors and combines and fastest-growing brand position in India.
- Strategic Sourcing Program and Margin TargetStrategic sourcing program progressing with early waves delivering; target to add 100–150 basis points of margin improvement from sourcing by 2030.
- Tariff Relief Trajectory and IEEPA Refund ActivitySome Section 232 tariffs reduced from 25% to 15% for certain products, lowering expected 2026 tariff impact; received $5 million Phase 1 IEEPA refund and filing ~ $135 million in Phase 2 claims (additional ~$15 million Phase 3 estimate).
- Guidance Narrowing and Full-Year OutlookManagement narrowed and adjusted full-year guidance: Industrial net sales flat to +2%; Industrial adjusted EBIT margin 3.2%–3.8%; industrial free cash flow forecast $200–$400 million.
- Underproduction Provides Potential 2027 TailwindCompany is currently underproducing to 2026 demand by ~4%, which management expects will create an automatic tailwind into 2027 as production aligns with retail demand.
DE:37C Earnings History
| Report Date | Fiscal Quarter | Forecast / EPS | Last Year's EPS | EPS YoY Change | Press Release |
|---|---|---|---|---|---|
| Nov 09, 2026 | 2026 (Q3) | 0.09- | 0.07 | ― | ― |
| Aug 03, 2026 | 2026 (Q2) | 0.090.12 | 0.15 | -23.53% (-0.04) | |
| Apr 30, 2026 | 2026 (Q1) | 0.000.01 | 0.09 | -90.00% (-0.08) | |
| Feb 17, 2026 | 2025 (Q4) | 0.100.17 | 0.13 | 26.67% (+0.04) | |
| Nov 07, 2025 | 2025 (Q3) | 0.120.07 | 0.21 | -66.67% (-0.14) | |
| Aug 01, 2025 | 2025 (Q2) | 0.130.15 | 0.34 | -55.26% (-0.19) | |
| May 01, 2025 | 2025 (Q1) | 0.080.09 | 0.29 | -69.70% (-0.21) | |
| Feb 04, 2025 | 2024 (Q4) | 0.160.13 | 0.37 | -64.29% (-0.24) | |
| Nov 07, 2024 | 2024 (Q3) | 0.250.21 | 0.37 | -42.86% (-0.16) | |
| Jul 31, 2024 | 2024 (Q2) | 0.330.34 | 0.46 | -26.92% (-0.12) |
The table shows recent earnings report dates and whether the forecast was beat or missed. See the change in forecast and EPS from the previous year.