

Essential Properties Realty (2OU) Q3 2026 Earnings Report
DE:2OU Q3 2026 EPS Results
- Actual EPS
- EUR 0.24
- Consensus EPS
- EUR 0.29
- Beat/Miss
- Missed by -EUR 0.05
- One Year Ago EPS
- EUR 0.30
DE:2OU Q3 2026 Revenue Results
- Actual Revenue
- EUR 152.82M
- Expected Revenue
- EUR 141.42M
- Beat/Miss
- Beat by +EUR 11.40M
- YoY Revenue Growth
- +16.38%
Earnings Announcement Details
- Quarter
- Q3 2026
- Date
- 10/21/2026
- Time
- After Close
- Conference Call
- Wednesday, October 21, 2026
Essential Properties Realty's next earnings date is estimated for February 17, 2027, based on past reporting schedules.
Q3 2026 Earnings Call Audio
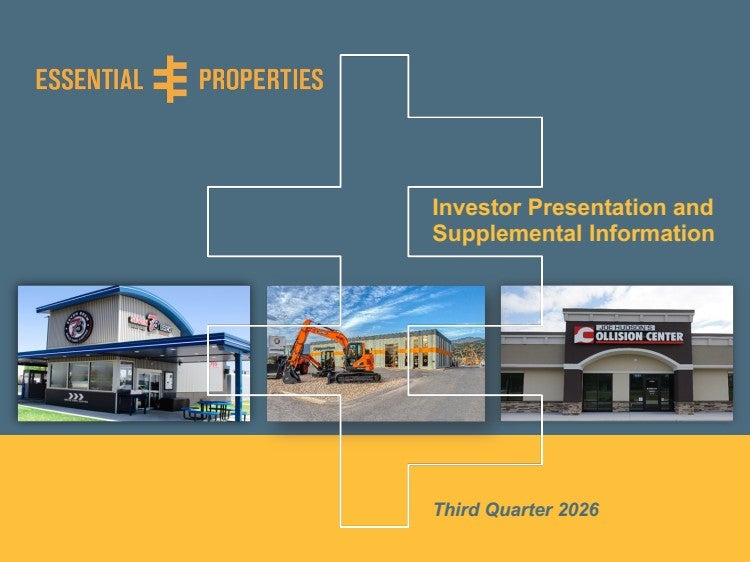
Q3 2026 Earnings Slide Deck
Q3 2026 Earnings Call Summary
The call was predominantly positive, supported by strong earnings growth, high occupancy, healthy rent coverage, improving tenant credit metrics, significant investment activity, accretive dispositions, ample liquidity, and raised 2026 guidance. The main challenges were volatile capital markets, a higher cost of capital, slower planned deployment, lower pipeline closing probabilities, refinancing decisions, and one property impairment. The conflicting 2026 AFFO guidance figures in the transcript also introduce some uncertainty.
For 2026, the company raised AFFO per share guidance to $2.02 to $2.05, implying growth of almost 8 percent at the midpoint, and investment volume guidance to $1.3 billion to $1.5 billion; Robert W. Salisbury later stated AFFO per share guidance of 2 dollars and 20 cents to 2 dollars and 50 cents, reflecting a growth rate of approximately 8 percent at the midpoint. Initial 2027 guidance calls for AFFO per share of 2 dollars and 10 cents to 2 dollars and 18 cents, investment volume of $1 billion to $1.5 billion, and cash G&A expense of $32 million to $37 million, with investment volume expected to be back end loaded and a slow pace of deployment over the next 2 to 3 quarters; the plan assumes approximately 2 hundred million dollars of dispositions next year, annual free cash flow after dividends approaching 2 hundred million dollars, no common equity in the near term, and no need to source external capital. The company expects dispositions to potentially increase from 25 million dollars a quarter to 50 million dollars a quarter, with a mid- to high- 6% cap rate range, while refinancing alternatives included unsecured bonds pricing in the high 6s, a convert pricing south of a 5, and bank debt in the 5.6% to 5.7% range.
- Strong Third-Quarter EarningsThe company reported GAAP net income of $60.7 million and AFFO of $111.9 million for the quarter. AFFO per share was $0.51, up 6% year over year, while nominal AFFO increased 16% year over year to $112 million.
- Significant Investment Volume at Attractive YieldsThe company invested $342 million across 100 properties in 31 transactions during the quarter, at a weighted average initial cash yield of 7.7% and a GAAP yield of 9.4%. The investments had a weighted average initial lease term of 17.9 years and annual rent escalations of 2.3%.
- Sale-Leasebacks Remain the Primary Growth ChannelSale-leaseback transactions represented 91% of quarterly investment volume. Management said operators continue to monetize real estate through sale-leasebacks as alternative financing sources have become more difficult to access.
- Higher-Yielding Forward PipelineThe forward pipeline has cap rates around 8% and GAAP yields in the high 9s, compared with the 7.7% initial cash yield and 9.4% GAAP yield on third-quarter investments. Management said it is repricing transactions and seeking higher returns without taking on incremental risk.
- Strong Balance Sheet and LiquidityPro forma leverage was 3.8x, and liquidity was reported at $1.3 billion. The company had $809 million of revolver capacity and $483 million of unsettled forward equity at an average price of $30.50 per share.
- Diversified and Highly Occupied PortfolioThe portfolio ended the quarter with approximately 2.58 thousand properties leased to tenants operating more than 700 concepts. Occupancy was 99.6%, with only 11 vacant properties; same-store rent growth was 1.4%, rent coverage was 3.5x, weighted average lease term was more than 14 years, and weighted average lease escalations were 1.9%.
- Low Near-Term Lease Expiration ExposureOnly 2% of annual base rent is scheduled to expire through 2028. Management also stated that leases generally include tenant-controlled renewal options, typically for 10 years or for four- or five-year periods.
- Improving Tenant Credit MetricsThe tenant credit watch list declined 50 basis points quarter over quarter to 1.1%. Management said tenant performance and coverage remained consistent, with no material negative trends, and the percentage of annual base rent with coverage below 1x was flat quarter over quarter.
- Accretive Property DispositionsThe company sold 11 properties for $17.9 million at a weighted average cap rate of 6.1%. The dispositions were primarily opportunistic sales of restaurant and car wash properties and were completed at cap rates accretive to the company's weighted average cost of capital.
- Broad Tenant DiversificationThe top 10 tenants represented 15.2% of annualized base rent and the top 20 tenants represented 25.1%, reflecting management's focus on middle-market operators and limiting concentration risk.
- Reduced Car Wash ExposureCar wash exposure declined by 60 basis points during the quarter to 12% of annualized base rent.
- Favorable G&A and Cash Flow PerformanceTotal G&A was $14.1 million and cash G&A was $7.3 million, representing 4.3% of total revenue versus 4.6% in the prior-year period. Cash G&A was trending toward the lower half of the full-year guidance range of $30 million to $34 million.
- Low Dividend Payout and Internal Capital GenerationThe company declared a quarterly cash dividend of $0.32 per share, representing an AFFO payout ratio of 63%. It retained $42 million of free cash flow during the quarter.
- Extended Debt Maturity ProfileThe company increased revolving credit facility capacity by $300 million to $1.3 billion and used the additional liquidity to prepay a $430 million term loan previously scheduled to mature in 2027. The company now has no debt maturities until 2028.
- Raised 2026 Investment and AFFO GuidanceManagement increased 2026 investment volume guidance to $1.3 billion to $1.5 billion after more than $1 billion of investments closed year to date. Peter Mavoides stated that 2026 AFFO per share guidance was increased to $2.02 to $2.05, implying almost 8% growth at the midpoint.
- Established 2027 Growth PlanInitial 2027 guidance included AFFO per share of $2.10 to $2.18, investment volume of $1 billion to $1.5 billion, and cash G&A expense of $32 million to $37 million. Management described the investment plan as conservative relative to historical performance and expects deployment to be back-end loaded.
- 2027 Funding Plan Fully CoveredManagement stated that funding for the 2027 investment plan is fully covered from available liquidity and leverage capacity, including free cash flow after dividends approaching $200 million annually, potential dispositions, expanded revolver capacity, and unsettled forward equity. The plan does not assume near-term common equity issuance.
- Disciplined Capital AllocationManagement expects a slower pace of deployment over the next two to three quarters while it waits for asset pricing to adjust to capital-market conditions. The company said its granular investment model, with typical transactions of $3 million to $10 million, provides flexibility and optionality.
- Stable Investment Strategy Across IndustriesManagement said its investment strategy has not changed, with transactions priced based on risk-adjusted returns and attractive spreads. The company expects the 2027 investment pipeline to remain broadly consistent with the overall portfolio rather than shifting materially toward higher-risk industries.
- Strong Repeat-Business and Relationship NetworkManagement said approximately 80% to 90% of its business comes from repeat relationships. It cited continued opportunities from middle-market operators seeking capital and said diminished competition from private lenders was contributing to pricing power.
- Healthy Consumer and Tenant TrendsManagement said there were no consumer or tenant trends that alarmed it. In some sectors, same-store sales were modestly down 2% to 3% while margins expanded, resulting in flat unit-level coverage.
- Credit Losses Trending Better Than GuidanceCredit losses were trending slightly better than guidance for the current year. Realized losses have been just under 30 basis points per year since portfolio inception, while the credit-loss assumption embedded in 2027 guidance is well in excess of that level.
- Additional Capital Sources AvailableManagement said bonus depreciation capital is a potentially attractive and sticky source of funding because of substantial tax incentives and penalties associated with selling assets after full depreciation. The company has not materially incorporated this source into its current guidance or disposition plan.
DE:2OU Earnings History
| Report Date | Fiscal Quarter | Forecast / EPS | Last Year's EPS | EPS YoY Change | Press Release |
|---|---|---|---|---|---|
| Feb 17, 2027 | 2026 (Q4) | 0.29- | 0.3 | ― | ― |
| Oct 21, 2026 | 2026 (Q3) | 0.290.24 | 0.3 | -18.18% (-0.05) | |
| Jul 22, 2026 | 2026 (Q2) | 0.300.30 | 0.29 | 6.25% (+0.02) | |
| Apr 22, 2026 | 2026 (Q1) | 0.290.25 | 0.26 | -3.45% (-0.01) | |
| Feb 11, 2026 | 2025 (Q4) | 0.290.30 | 0.27 | 13.33% (+0.04) | |
| Oct 22, 2025 | 2025 (Q3) | 0.280.30 | 0.24 | 22.22% (+0.05) | |
| Jul 23, 2025 | 2025 (Q2) | 0.280.29 | 0.26 | 10.34% (+0.03) | |
| Apr 23, 2025 | 2025 (Q1) | 0.260.26 | 0.25 | 3.57% (+0.01) | |
| Feb 12, 2025 | 2024 (Q4) | 0.270.27 | 0.28 | -3.23% (-0.01) | |
| Oct 23, 2024 | 2024 (Q3) | 0.270.24 | 0.26 | -6.90% (-0.02) |
The table shows recent earnings report dates and whether the forecast was beat or missed. See the change in forecast and EPS from the previous year.
