

iA Financial Corporation Inc (1OD) Q2 2026 Earnings Report
DE:1OD Q2 2026 EPS Results
- Actual EPS
- EUR 2.36
- Consensus EPS
- EUR 2.18
- Beat/Miss
- Beat by +EUR 0.17
- One Year Ago EPS
- EUR 2.24
DE:1OD Q2 2026 Revenue Results
- Actual Revenue
- EUR 2.98B
- Expected Revenue
- ―
- Beat/Miss
- ―
- YoY Revenue Growth
- +78.73%
Earnings Announcement Details
- Quarter
- Q2 2026
- Date
- 08/04/2026
- Time
- After Close
- Conference Call
- Tuesday, August 4, 2026
iA Financial Corporation Inc's next earnings date is estimated for November 9, 2026, based on past reporting schedules.
Q2 2026 Earnings Call Audio
No earnings call audio is available for this earnings event.
Q2 2026 Earnings Slide Deck
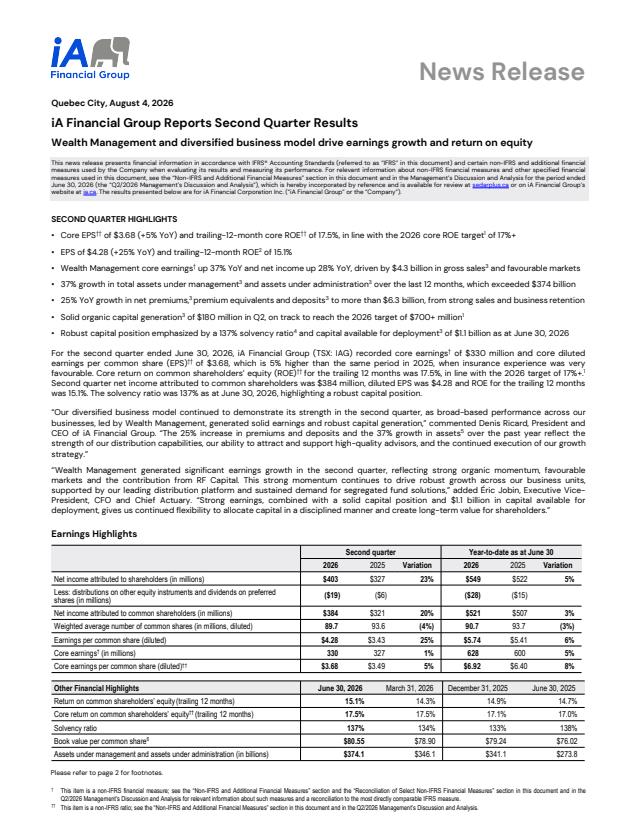
Q2 2026 Earnings Call Summary
The call communicates a broadly positive performance: strong earnings, ROE in line with targets, robust capital position, substantial business growth (notably in Wealth Management), and continued shareholder returns. Most negative items are localized (U.S. Dealer Services underperformance, a specific mortality loss at Fidelity Life, Investment segment headwinds, and some mutual fund outflows) and management outlined remedial actions and a path to improvement. Capital constraints driven by reserve accounting are a near-term limitation but solvency remains strong. Overall, the highlights substantially outweigh the lowlights.
The company reiterated 2026 targets and a constructive outlook backed by strong metrics: trailing-12‑month core ROE is 17.5% (quarterly annualized 18.5%), core EPS $3.68 (+5% YoY) and reported EPS $4.28 (+25% YoY), with core earnings of $330M and net income $384M; capital remains robust with a 137% solvency ratio, $1.1B capital available for deployment, $180M (reported $188M corrected to $180M) organic capital generated in Q2 and $335M YTD toward a >$700M 2026 objective (with H2 typically stronger), and $347M returned via buybacks; dividend policy and tax/expense guidance includes a core dividend payout ratio ≈30%, consolidated core effective tax rate 21.2% in Q2 (expected toward the upper end of 21–23% in Q3/Q4), core corporate expenses $74M with core other expenses ~$65M (target range $70M ± $5M) expected to trend to the midpoint; and business growth underpinning guidance: net premiums/premium equivalents/deposits $6.3B (+25% YoY), AUA/AUM growth +37% YoY (Wealth AUM +15% YoY), Wealth gross sales $4.3B and combined net inflows $934M (individual segregated fund gross >$2B, +52%, net sales >$1B; mutual funds gross $644M, +46%, net outflows $73M), U.S. individual sales US$86M (+10%) and Dealer Services US$292M, Insurance Canada individual sales $102M, Dealer Services Canada $218M, iA Auto & Home direct written premium $216M (+5%), and book value per common share $80.55 (+6% YoY).
- Strong Earnings and EPS GrowthCore EPS of $3.68, up 5% year-over-year; reported EPS of $4.28, up 25% year-over-year. Quarterly core earnings were $330 million and net income was $384 million, supported by favorable market-related impacts.
- Return on Equity and Profitability Targets MetTrailing 12-month core ROE reached 17.5%, meeting the 2026 target (>=17%). Quarterly annualized core ROE was 18.5%.
- Material Business Growth in Premiums, Deposits and AssetsNet premiums, premium equivalents and deposits totaled $6.3 billion, up 25% year-over-year. Assets under management and administration grew 37% over the last 12 months; Wealth Management AUM increased 15% year-over-year.
- Wealth Management MomentumWealth gross sales reached $4.3 billion; combined net inflows for segregated and mutual funds were $934 million. Individual segregated fund gross sales rose 52% year-over-year to over $2 billion; mutual fund gross sales rose 46% to $644 million (despite net outflows). Wealth Management core earnings increased 37% year-over-year to $155 million; RF Capital contributed $13 million.
- Capital Generation and Financial StrengthSolvency ratio of 137% (up 3 percentage points sequentially) with $1.1 billion of capital available for deployment. Generated $335 million of organic capital year-to-date and $180 million (reported as $188M then corrected) in the quarter; on track toward >$700 million objective for 2026.
- Shareholder Returns and Book Value GrowthDeployed $347 million through the share buyback program during the quarter in addition to regular dividends. Book value per common share reached $80.55, up 6% over the last 12 months. Core dividend payout ratio ~30%, within target range.
- Insurance Canada Stability and Underwriting DisciplineInsurance Canada core earnings of $128 million. Individual Insurance sales of $102 million (comparable to prior year). Favorable experience contributed $19 million pretax this quarter, reflecting disciplined underwriting and risk management.
- U.S. Individual Insurance Record SalesU.S. Individual Insurance sales reached a quarterly record of USD 86 million, up 10% year-over-year, driven by final expense and middle market growth.
- Investment Segment Performance and Positive Market ImpactCore net investment result of $129 million (expected earnings $119M plus favorable credit experience $10M). The quarter benefited from a positive macroeconomic impact and strong public equity performance, contributing to a positive core earnings adjustment of $104 million.
- Disciplined Expense ManagementCore corporate expenses totaled $74 million before taxes, near the low end of the quarterly target range; continued investment in strategic priorities while controlling operating costs.
DE:1OD Earnings History
| Report Date | Fiscal Quarter | Forecast / EPS | Last Year's EPS | EPS YoY Change | Press Release |
|---|---|---|---|---|---|
| Nov 09, 2026 | 2026 (Q3) | 2.42- | 2.22 | ― | ― |
| Aug 04, 2026 | 2026 (Q2) | 2.182.36 | 2.24 | 5.44% (+0.12) | |
| May 05, 2026 | 2026 (Q1) | 2.092.08 | 1.86 | 11.68% (+0.22) | |
| Feb 17, 2026 | 2025 (Q4) | 2.111.99 | 1.95 | 1.97% (+0.04) | |
| Nov 04, 2025 | 2025 (Q3) | 2.142.22 | 1.88 | 18.43% (+0.35) | |
| Aug 05, 2025 | 2025 (Q2) | 1.952.24 | 1.76 | 26.91% (+0.47) | |
| May 07, 2025 | 2025 (Q1) | 1.831.86 | 1.56 | 19.26% (+0.30) | |
| Feb 18, 2025 | 2024 (Q4) | 1.791.95 | 1.5 | 29.91% (+0.45) | |
| Nov 05, 2024 | 2024 (Q3) | 1.681.88 | 1.6 | 17.20% (+0.28) | |
| Aug 06, 2024 | 2024 (Q2) | 1.631.76 | 1.53 | 15.06% (+0.23) |
The table shows recent earnings report dates and whether the forecast was beat or missed. See the change in forecast and EPS from the previous year.
