


Afya earnings date
Afya (1AY) Q3 2026 Earnings Report
DE:1AY Q3 2026 EPS Results
- Actual EPS
- EUR 0.33
- Consensus EPS
- EUR 0.31
- Beat/Miss
- Beat by +EUR 0.03
- One Year Ago EPS
- EUR 0.33
DE:1AY Q3 2026 Revenue Results
- Actual Revenue
- EUR 173.96M
- Expected Revenue
- EUR 158.16M
- Beat/Miss
- Beat by +EUR 15.80M
- YoY Revenue Growth
- +12.54%
Earnings Announcement Details
- Quarter
- Q3 2026
- Date
- 11/12/2026
- Time
- After Close
- Conference Call
- Thursday, November 12, 2026
Afya's next earnings date is estimated for March 18, 2027, based on past reporting schedules.
Q3 2026 Earnings Call Audio
Q3 2026 Earnings Slide Deck
Q3 2026 Earnings Call Summary
The call was predominantly positive, with solid revenue and adjusted EBITDA growth, margin expansion, strong cash conversion, shareholder returns, capacity growth, improved clinical-management payer penetration, and favorable ESG and internal ENAMED results. These strengths were partly offset by weak revenue growth in Continuing Education and Medical Practice Solutions, lower residency students and monthly active users, margin compression in the two investment-cycle segments, higher FIES-related receivables, and higher gross debt and borrowing costs.
Management said it expects to deliver the 2026 guidance provided at the beginning of the year, with 2027 margin guidance to be released with 2026 results in March; medical gross tuition was passed at 5.7% to next year, while it is “very early” to call the 2027 first semester intake and management is “kind of optimistic.” Continuing Education is aiming for “same-store sales” to “go north in one single digit” in 2028 and “Continuing Education 2027,” with the fourth quarter expected to follow “the same trend” as the entire year; CapEx is expected to be between BRL 340 million to BRL 380 million in the year; FIES positions are not expected to increase, with approximately 22% of medical students using FIES as of the third quarter, and FIES expected to be “flat or a little bit lower” in terms of FIES for 2028; preliminary ENAMED results are expected to be released in December.
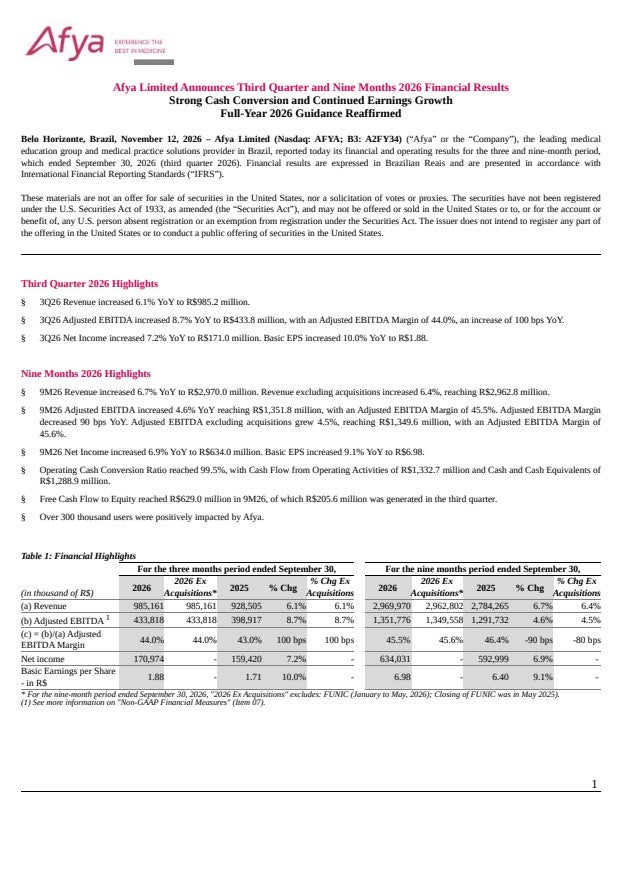
- Quarterly and Nine-Month Revenue GrowthThird-quarter revenue increased 6% year-over-year to BRL 985 million. For the first 9 months of 2026, revenue grew almost 7% year-over-year to BRL 2,970 million.
- Adjusted EBITDA Growth and Margin ExpansionThird-quarter adjusted EBITDA increased 9% year-over-year to BRL 434 million, with adjusted EBITDA margin reaching 44%, up 100 basis points. Nine-month adjusted EBITDA increased almost 5% to BRL 1.3 billion, with a 45.5% margin.
- Net Income and EPS GrowthNine-month net income reached BRL 634 million, up 7% year-over-year, while basic EPS reached BRL 6.98, up 9% from BRL 6.40. Third-quarter EPS was BRL 1.88, up 10% from BRL 1.71, reflecting the impact of the share repurchase program.
- Strong Cash GenerationOperating cash flow reached BRL 1,333 million in the first 9 months of 2026, up 3% from BRL 1,291 million. Cash conversion was 99.5%, and free cash flow to equity reached BRL 629 million, including BRL 206 million in the third quarter.
- Undergraduate Medical Capacity and Student GrowthOperating medical seats increased more than 5% year-over-year to 3,785, while the undergraduate medical student base grew 3% to more than 26,000 students. Medical school net average tickets increased 4% to BRL 9,466.
- Health Sciences Portfolio ExpansionAverage health science students increased 18% year-over-year, reflecting continued growth in the health-related undergraduate portfolio. Afya also secured authorization for 17 additional medical seats at Afya Cruzeiro do Sul on September 18.
- Undergraduate Segment Revenue and Margin PerformanceUndergraduate segment revenue increased more than 7% to BRL 2,642 million in the first 9 months of 2026. The segment's gross margin was 100 basis points above the prior-year quarter, supported by growth in health programs, increased students per class, combining health-related disciplines, and faculty-cost efficiencies.
- Continuing Education Student GrowthThe Continuing Education student base expanded 10% in the first 9 months of 2026. The undergraduate journey student base increased 2% to 9,386, while other B2P and B2B offerings grew 17% to 36,345 students.
- Medical Practice Solutions Payer GrowthTotal active payers in Medical Practice Solutions increased 2% year-over-year to approximately 206,000. Clinical management active payers increased 20% to 52,000, reflecting continued penetration of Afya iClinic.
- Growing Ecosystem ReachAfya's ecosystem reached more than 300,000 users actively engaging with its services and products by the end of the third quarter of 2026.
- Strong ENAMED Internal AssessmentBased on Afya's internal assessment, student results were approximately 18 percentage points above the prior ENAMED exam on a simple average, with management also reporting better proficiency rates across campuses. Management stated that no additional ENAMED-related costs were incurred because the preparation was conducted internally.
- Shareholder Returns and Debt ReductionAfya returned BRL 459 million to shareholders through dividends and share repurchases during the first 9 months of 2026. Net debt was reduced by BRL 170 million, and net debt excluding IFRS 16 was 0.7x the midpoint of 2026 adjusted EBITDA guidance.
- Extended Debt Maturity ProfileAverage debt duration increased from 1.9 years to 3.7 years between September 2025 and September 2026, extending the maturity profile.
- Strong ESG RecognitionAfya achieved an AA MSCI ESG rating, becoming the highest-rated company in the education sector in Latin America, and achieved ESG leader status within the diversified consumer servicing industry.
- Positive Tuition and Guidance CommentaryManagement said it had passed through 5.7% over gross tuition for next year and described its outlook as cautiously optimistic based on second-half 2026 performance. Management also reiterated that it expects to deliver the full-year guidance provided at the beginning of 2026, including CapEx guidance of BRL 340 million to BRL 380 million.
DE:1AY Earnings History
| Report Date | Fiscal Quarter | Forecast / EPS | Last Year's EPS | EPS YoY Change | Press Release |
|---|---|---|---|---|---|
| Mar 18, 2027 | 2026 (Q4) | 0.31- | 0.36 | ― | ― |
| Nov 12, 2026 | 2026 (Q3) | 0.310.33 | 0.33 | 0.05% (+0.00) | |
| Aug 13, 2026 | 2026 (Q2) | 0.320.35 | 0.36 | -2.64% (-0.01) | |
| May 07, 2026 | 2026 (Q1) | 0.460.46 | 0.51 | -10.91% (-0.06) | |
| Mar 13, 2026 | 2025 (Q4) | 0.290.36 | 0.34 | 7.14% (+0.02) | |
| Nov 12, 2025 | 2025 (Q3) | 0.270.33 | 0.29 | 16.20% (+0.05) | |
| Aug 13, 2025 | 2025 (Q2) | 0.310.36 | 0.37 | -0.87% (-0.00) | |
| May 09, 2025 | 2025 (Q1) | 0.430.51 | 0.44 | 16.79% (+0.07) | |
| Mar 13, 2025 | 2024 (Q4) | 0.260.34 | 0.29 | 17.32% (+0.05) | |
| Nov 13, 2024 | 2024 (Q3) | 0.290.29 | 0.22 | 29.71% (+0.07) |
The table shows recent earnings report dates and whether the forecast was beat or missed. See the change in forecast and EPS from the previous year.
