

Exchange Income (0ON) Q2 2026 Earnings Report
DE:0ON Q2 2026 EPS Results
- Actual EPS
- EUR 0.72
- Consensus EPS
- EUR 0.67
- Beat/Miss
- Beat by +EUR 0.05
- One Year Ago EPS
- EUR 0.59
DE:0ON Q2 2026 Revenue Results
- Actual Revenue
- EUR 610.05M
- Expected Revenue
- EUR 586.10M
- Beat/Miss
- Beat by +EUR 23.95M
- YoY Revenue Growth
- +32.26%
Earnings Announcement Details
- Quarter
- Q2 2026
- Date
- 08/11/2026
- Time
- After Close
- Conference Call
- Tuesday, August 11, 2026
Exchange Income's next earnings date is estimated for November 12, 2026, based on past reporting schedules.
Q2 2026 Earnings Call Audio
No earnings call audio is available for this earnings event.
Q2 2026 Earnings Slide Deck
Q2 2026 Earnings Call Summary
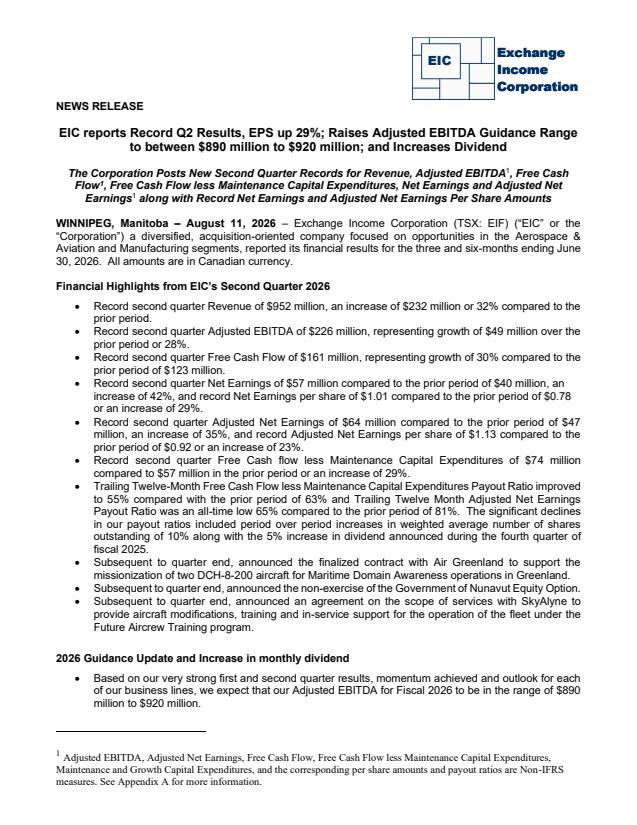
The call conveyed a strongly positive operational and financial trajectory: record-setting Q2 results, meaningful guidance increases, improved per-share metrics (EPS +29%, adjusted EPS +23%), a dividend raise, low leverage (2.82x) and robust liquidity (>CAD 2 billion). Segment-level momentum was broad—Aerospace & Aviation, Aircraft Sales & Leasing (including successful MACH 2 integration), and Manufacturing (composite mats, windows, precision manufacturing) all showed encouraging trends. Offsetting risks are manageable in the near term (inflationary cost pressures, MRO/supply constraints, working capital seasonality, tariff exposure, and some regional softness). Overall, the positive achievements and financial strength materially outweigh the challenges raised on the call.
Management materially raised 2026 guidance, now forecasting adjusted EBITDA of CAD 890–920 million, supported by Q2 record results across revenue, adjusted EBITDA, net earnings and adjusted net earnings (Q2 net earnings per share CAD 1.01, +29% YoY; adjusted net earnings per share CAD 1.13, +23% YoY). Strong cash generation drove a free cash flow less maintenance CapEx payout ratio of ~55% (near an all‑time low) and an adjusted net earnings payout ratio at an all‑time low of 65%, enabling a dividend increase from CAD 2.76 to CAD 2.88 annualized; balance sheet metrics remain healthy with aggregate leverage ~2.82x and over CAD 2 billion of available liquidity. Management noted YTD growth capex of CAD 120 million, Q2 maintenance/growth capex of CAD 76 million (Aerospace & Aviation) and CAD 10 million (Manufacturing), seasonal strength into Q3 with Q3 profitability expected slightly above prior year and Q4 in line, and said reaching a CAD 1 billion EBITDA framework (~10% growth) is achievable though 2027 guidance will be provided with Q3 results.
- Record Q2 Performance Across Key MetricsSet second-quarter records in revenue, adjusted EBITDA, net earnings, adjusted net earnings, free cash flow, and free cash flow less maintenance CapEx. Net earnings per share were CAD 1.01, up 29% year-over-year, and adjusted net earnings per share were CAD 1.13, up 23% year-over-year.
- Raised FY2026 Adjusted EBITDA GuidanceUpdated full-year adjusted EBITDA guidance to CAD 890 million–CAD 920 million (midpoint above CAD 900 million). Management raised guidance multiple times during the year reflecting accelerating performance and stronger outlook.
- Dividend Increase and Strong Payout MetricsBoard increased the annualized dividend from CAD 2.76 to CAD 2.88 (an increase of ~4.35%). Free cash flow less maintenance CapEx payout ratio is near an all-time low at 55%, and adjusted net earnings payout ratio is an all-time low at 65%.
- Healthy Balance Sheet and Significant LiquidityAggregate leverage remains low at 2.82x and the company has over CAD 2 billion of available liquidity to fund acquisitions and growth investments. Year-to-date growth capital expenditures were CAD 120 million.
- Aerospace & Aviation: Contract Wins and Operational MomentumFinalized scope for the Future Aircrew Training program (modifications to begin 2027 with bulk of work in first five years). Won contract with Air Greenland for modification/integration of two ISR aircraft starting in Q3 and continuing through 2027. Air Canada commercial arrangement expanded and extended; full-motion King Air simulator is certified and operational. Management expects Q3 profitability to be slightly higher than the prior year comparative.
- Aircraft Sales & Leasing and Parts Demand Remain RobustStrong demand for leasing, parts, and engines; strategic purchases of whole aircraft for resale and parts inventory. Integration of MACH 2 has exceeded expectations and is contributing to parts/engine/aircraft performance alongside Regional One.
- Manufacturing – Environmental Access Solutions at Full CapacityComposite mat production ran at full capacity with all 2026 output already sold. Market share is shifting to composite mats in the Southern U.S.; new Spartan (Saltillo) plant is on time and on budget and targeted to be operational later in 2027. Canadian rental demand for wooden mats is increasing ahead of large linear projects.
- Stronger Bookings in Multi-Storey Windows and Precision ManufacturingSecond-quarter bookings for Multi-Storey Window Solutions were the strongest quarter in several years. Precision Manufacturing & Engineering order books are improving with exposure to aerospace, defense, telecommunications and data center opportunities (e.g., 12-month sold-out order book at SFI for cooling tanks).
DE:0ON Earnings History
| Report Date | Fiscal Quarter | Forecast / EPS | Last Year's EPS | EPS YoY Change | Press Release |
|---|---|---|---|---|---|
| Nov 12, 2026 | 2026 (Q3) | 1.03- | 0.94 | ― | ― |
| Aug 11, 2026 | 2026 (Q2) | 0.670.72 | 0.59 | 22.83% (+0.13) | |
| May 11, 2026 | 2026 (Q1) | 0.230.39 | 0.18 | 117.86% (+0.21) | |
| Feb 24, 2026 | 2025 (Q4) | 0.650.68 | 0.51 | 32.50% (+0.17) | |
| Nov 06, 2025 | 2025 (Q3) | 0.950.94 | 0.76 | 23.73% (+0.18) | |
| Aug 11, 2025 | 2025 (Q2) | 0.580.59 | 0.49 | 19.48% (+0.10) | |
| May 12, 2025 | 2025 (Q1) | 0.180.18 | 0.13 | 40.00% (+0.05) | |
| Feb 26, 2025 | 2024 (Q4) | 0.530.51 | 0.45 | 14.29% (+0.06) | |
| Nov 07, 2024 | 2024 (Q3) | 0.780.76 | 0.7 | 8.26% (+0.06) | |
| Aug 08, 2024 | 2024 (Q2) | 0.530.49 | 0.6 | -17.20% (-0.10) |
The table shows recent earnings report dates and whether the forecast was beat or missed. See the change in forecast and EPS from the previous year.
