


Canadian Apartment earnings date
Canadian Apartment (0OJ) Q3 2026 Earnings Report
DE:0OJ Q3 2026 EPS Results
- Actual EPS
- -EUR 0.71
- Consensus EPS
- ―
- Beat/Miss
- ―
- One Year Ago EPS
- EUR 0.10
DE:0OJ Q3 2026 Revenue Results
- Actual Revenue
- EUR 155.63M
- Expected Revenue
- EUR 155.80M
- Beat/Miss
- Missed by -EUR 173.53K
- YoY Revenue Growth
- -2.26%
Earnings Announcement Details
- Quarter
- Q3 2026
- Date
- 11/04/2026
- Time
- After Close
- Conference Call
- Wednesday, November 4, 2026
Canadian Apartment's next earnings date is estimated for February 25, 2027, based on past reporting schedules.
Q3 2026 Earnings Call Audio
No earnings call audio is available for this earnings event.
Q3 2026 Earnings Slide Deck
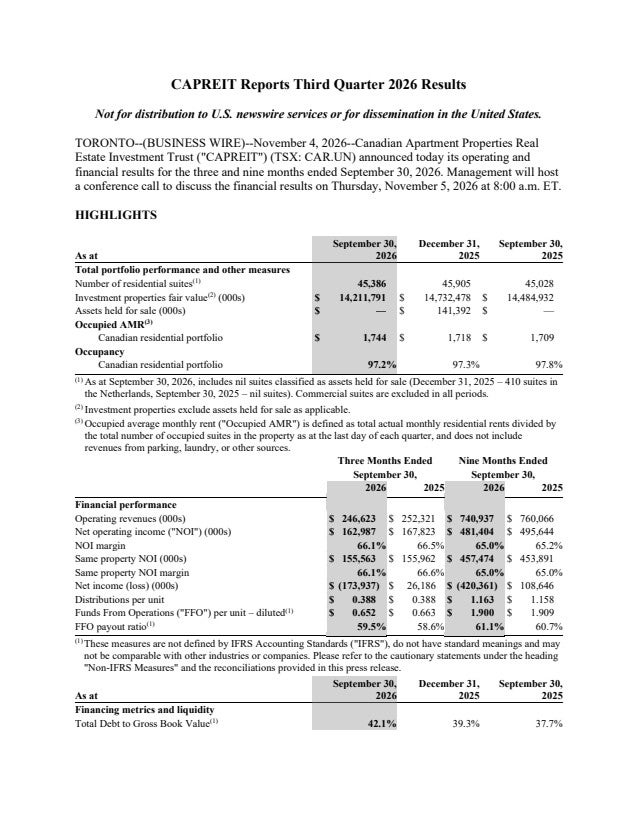
Q3 2026 Earnings Call Summary
The call was cautiously constructive but balanced. CAPREIT reported strong occupancy relative to industry benchmarks, positive blended turnover rent growth, stable year-to-date NOI margins, active unit repurchases, and encouraging trends in the GTA and incentive levels. These positives were offset by a 1.7% decline in quarterly diluted FFO per unit, regional NOI declines, ongoing supply and population-related leasing pressure, higher maintenance and operating costs, and refinancing costs that are expected to pressure earnings over the next few quarters.
Management expects “the next few quarters” to remain challenging, with “about 15-17 months left” for peak leases to turn over, “assuming market rents hold flat”; it said “modest growth in the top line from a rent perspective is achievable,” it is “definitely looking to achieve some gains on the occupancy front,” and will “hopefully be able to use less incentives in the GTA,” although some markets will “probably have to continue to use incentives.” If conditions stabilize, management is “hopeful” it could start to push rents “come the start of the leasing season in April. Modestly.” Costs are “probably 3%-4%,” and CAPREIT expects to complete “approximately $1,200,000,000” in total mortgage refinancings for 2026, “assuming no acquisitions or dispositions”; its NCIB program will remain a “capital allocation priority” pursued on a “leverage-neutral basis funded by disposition proceeds.”
- Leadership Strengthened with New Chief Operating OfficerCAPREIT welcomed and onboarded James Lawrence as Chief Operating Officer during Brad Cutsey's first full quarter. James brings extensive property management experience and has become an integral part of the leadership team.
- Active Capital Recycling and European PrivatizationYear-to-date, CAPREIT completed approximately $88 million of acquisitions and dispositions in Canada, $145 million of property divestments in Europe, and the $99 million privatization of European Residential REIT, providing greater flexibility to manage for sale the remaining European assets.
- Significant NCIB Unit RepurchasesCAPREIT deployed approximately $101 million year-to-date in its NCIB program to repurchase 2.9 million trust units at a weighted average price of $34.83 per unit. Since 2022, it has deployed approximately $1.1 billion to repurchase 24.8 million trust units at a weighted average price of $42.80 per unit. The 2026 repurchases were made at a sizable discount to the September 30 diluted NAV per unit of $52.94.
- Canadian Occupancy Remained Above Industry BenchmarksSame-property Canadian occupancy was 97.2% on September 30, compared with Yardi's national quarterly average of 95.3%. Occupancy remained relatively stable at 97.1% as of October 31.
- Positive Same-Property Rent Growth and Stable Year-to-Date MarginSame-property occupied AMR increased 1.8% year-over-year. Supported by effective cost-control initiatives, the Canadian same-property NOI margin was 64.8% for the nine months ended September 30, consistent with the prior-year period.
- Turnover Rent Trends Returned to Positive TerritoryBlended change in monthly rent on turnover improved to positive 0.3% in the third quarter from -1.2% in the second quarter and -2.1% in the first quarter. The measure improved further to 0.4% in October. Leases held for two years or longer generated 5.9% positive rent growth, up from 5.4% in the prior quarter.
- Shorter-Tenure Rent Declines ModeratedApproximately 48% of Canadian turnover came from residents who had occupied their suites for less than two years. The average rent decrease for these leases improved to 5.2%, compared with declines of 7.1% in the second quarter and 10.8% in the first quarter.
- Meaningful Embedded Mark-to-Market OpportunityThe estimated mark-to-market spread across the total Canadian residential portfolio was 16%. Longer-tenured leases, representing 68% of residents, continued to generate positive average rent uplifts on turnover.
- Strong Toronto and Regional Occupancy PerformanceToronto occupancy was 98.5% as of September 30, compared with Yardi's quarterly average of 95.4%, while occupied AMR increased 1.9% year-over-year to $1,873. Vancouver occupancy improved to 97.6%, ahead of Yardi's 96.1% average, and Montréal occupancy of 94.7% remained above Yardi's 94.3% average.
- Positive NOI Growth in Ottawa and HalifaxOttawa NOI increased 4.1% and Halifax NOI increased 3.3%. Ottawa was nearly fully occupied at 99.6%, while Halifax delivered the highest AMR growth in the portfolio at 4.4%.
- Lower Incentive Activity Suggests Easing Leasing ConditionsNew residential incentives granted across the portfolio were down 27% from the second quarter. Incentives granted across the GTA were down 31% from the second quarter, while Toronto occupancy remained 98.5%.
- Portfolio NOI Margin Stable Year-to-DateFor the first nine months of 2026, same-property Canadian operating revenues and operating costs each increased 0.8%, resulting in a stable NOI margin of 64.8%.
- Healthy FFO Payout Ratio and Mortgage ProfileDiluted FFO per unit was $1.90 for the first nine months of 2026, with an FFO payout ratio of 61.1%. As of September 30, Canadian mortgages had a weighted average effective interest rate of 3.4% and a weighted average term to maturity of 4.4 years.
- Mortgage Refinancing Program ProgressingCAPREIT expects to complete approximately $1.2 billion of total mortgage refinancings for 2026, assuming no acquisitions or dispositions, with $960 million completed or committed as of the call. Management plans to continue laddering maturities across five-year and 10-year terms to mitigate renewal risk.
- Constructive View of the GTA and Long-Term Portfolio PotentialManagement remained constructive on the GTA, which is CAPREIT's largest market, citing several quarters of improving trends. Management also said it remains extremely bullish on the portfolio's long-term potential and sees opportunities to enhance portfolio quality and create value for unitholders.
- Operational Improvement Priorities IdentifiedManagement's priorities include strengthening leasing execution and resident retention, delivering customer-centric service, and using technology, data, and simpler processes to improve efficiencies across the platform. Further details are expected at the November 19 Investor Day.
DE:0OJ Earnings History
| Report Date | Fiscal Quarter | Forecast / EPS | Last Year's EPS | EPS YoY Change | Press Release |
|---|---|---|---|---|---|
| Feb 25, 2027 | 2026 (Q4) | ―- | 0.36 | ― | ― |
| Nov 04, 2026 | 2026 (Q3) | ―-0.71 | 0.1 | -778.31% (-0.82) | |
| Aug 06, 2026 | 2026 (Q2) | ―-0.26 | 0.29 | -188.60% (-0.55) | |
| May 07, 2026 | 2026 (Q1) | ―-0.74 | 0.03 | -2497.96% (-0.77) | |
| Feb 12, 2026 | 2025 (Q4) | ―0.36 | -0.18 | 293.15% (+0.54) | |
| Nov 06, 2025 | 2025 (Q3) | ―0.10 | 0.18 | -40.71% (-0.07) | |
| Aug 07, 2025 | 2025 (Q2) | ―0.29 | 0.42 | -29.97% (-0.13) | |
| May 08, 2025 | 2025 (Q1) | ―0.03 | 0.68 | -95.45% (-0.65) | |
| Feb 13, 2025 | 2024 (Q4) | ―-0.18 | 0.03 | -640.74% (-0.22) | |
| Nov 07, 2024 | 2024 (Q3) | ―0.18 | -1.33 | 113.25% (+1.51) |
The table shows recent earnings report dates and whether the forecast was beat or missed. See the change in forecast and EPS from the previous year.
