


CapitaLand Integrated Commercial Trust earnings date
CapitaLand Integrated Commercial Trust (CPAMF) Q2 2026 Earnings Report
CPAMF Q2 2026 EPS Results
- Actual EPS
- $0.07
- Consensus EPS
- ―
- Beat/Miss
- ―
- One Year Ago EPS
- $0.04
CPAMF Q2 2026 Revenue Results
- Actual Revenue
- $666.52M
- Expected Revenue
- $655.06M
- Beat/Miss
- Beat by +$11.46M
- YoY Revenue Growth
- +6.88%
Earnings Announcement Details
- Quarter
- Q2 2026
- Date
- 08/11/2026
- Time
- After Close
- Conference Call
- Tuesday, August 11, 2026
CapitaLand Integrated Commercial Trust's next earnings date is estimated for July 28, 2027, based on past reporting schedules.
Q2 2026 Earnings Call Audio
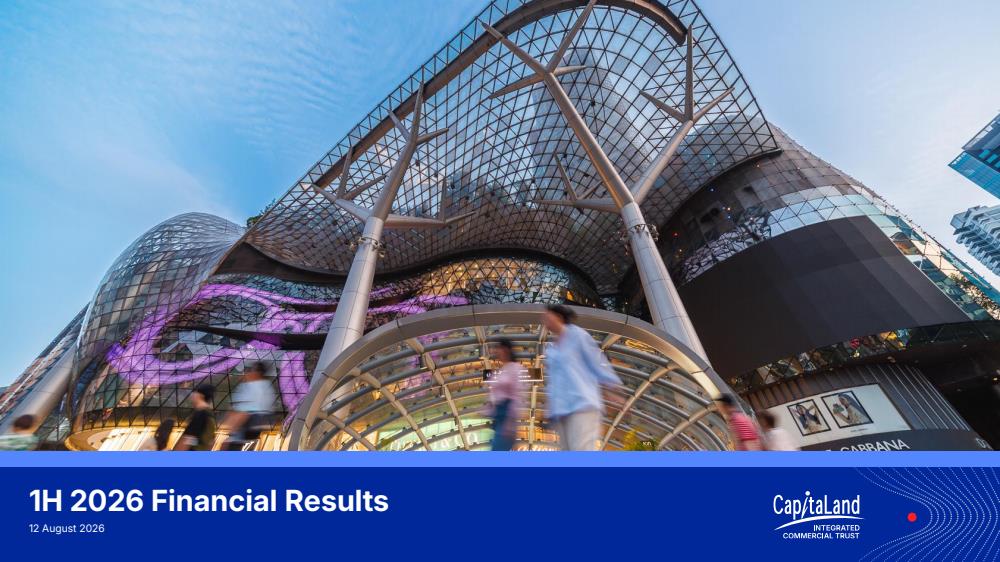
Q2 2026 Earnings Slide Deck
Q2 2026 Earnings Call Summary
The call presented a predominantly positive operational and financial performance: strong revenue, NPI and distributable income growth, high occupancies, positive rent reversions, successful portfolio transactions (Paragon acquisition, Bukit Panjang divestment) and a healthier balance sheet with lower average borrowing cost. Headwinds were acknowledged but mostly manageable or 'optical' (JV income drop due to consolidation), including modest retail sales moderation, AEI-related downtime, some underperforming assets (MAC) and a challenging European divestment market. Management highlighted several forward growth drivers (Paragon full-year impact, Gallileo, AEI completions, hedged energy costs) while flagging interest-rate and market timing risks. Overall, highlights materially outweigh the lowlights.
Management said growth will be driven by inorganic and organic drivers — Paragon completed 1 July (1.7% accretion), continued contribution from Gallileo, and AEIs (Tampines ~96% committed) — and backed by strong H1 results: gross revenue +7.5% to $846.8m, NPI +8.7% to $630.5m (Q2 NPI +9.6%), distributable income +13.3% to $466.7m and DPU +7.1% to $0.0602 despite a 5.8% larger unit base (~7.73bn units); portfolio occupancy 95.6% (retail 97.7%, office 94.4%), rent reversions retail 4.0% (suburban 5.1%, downtown 3.2%), office 7.6%, WALE ~3 years, tenant sales +1.6% YoY (downtown +1.7%, suburban +1.6%), NAV $2.15 (from $2.14), aggregate leverage down to 37.4% (from 38.5%) with avg cost of debt 2.9% (1% rate rise ≈ -$0.0027 DPU), energy hedged to mid‑2027 and AST2 divestment on track for H2 — overall guidance is for continued mid‑single‑digit organic rental growth, incremental accretion from Paragon and AEIs, limited further interest‑cost headroom, and disciplined capital deployment within regulatory development caps.
- Strong Top-Line and NPI GrowthGross revenue increased 7.5% YoY to $846.8 million and NPI rose 8.7% YoY to $630.5 million, driven by CapitaSpring consolidation and contribution from Gallileo.
- Double-Digit Distributable Income GrowthDistributable income increased 13.3% YoY to $466.7 million, reflecting strong operating performance and acquisitions.
- DPU Growth Despite Enlarged Unit BaseDPU grew 7.1% YoY to $0.0602, achieved despite a 5.8% increase in weighted average units outstanding following a private placement to fund the Paragon acquisition.
- Healthy Occupancy and Leasing MetricsPortfolio occupancy remained high at 95.6% (up 0.4ppt). Retail occupancy was 97.7% and office occupancy improved to 94.4% (up 0.7ppt). WALE ~3 years; top-10 tenants represent 16% of gross rental income with no single tenant >5%.
- Positive Rent ReversionsRetail portfolio rent reversion was +4.0% (downtown +3.2%; suburban +5.1%). Office rent reversion reported at +7.6%, and average Singapore office rent reached $11.03/sqft/month.
- Disciplined Balance Sheet and Lower Cost of DebtAggregate leverage reduced from 38.5% to 37.4%; average cost of debt at 2.9%. NAV increased slightly to $2.15 from $2.14 at year-end 2025; debt maturities well spread to 2035. Management estimates a 1% interest rate rise would reduce DPU by about $0.0027.
- Active Portfolio Management and Accretive TransactionsCompleted Paragon acquisition (1 July) — a freehold Orchard Road asset (previously guided ~1.7% accretion on a full-year basis). Continued AEI progress (Tampines Mall AEI ~96% committed or in advanced talks), sale of Bukit Panjang concluded at a premium, and Asia Square Tower 2 divestment on track to complete in H2.
- International Asset ContributionsGallileo (Germany) materially contributed to first-half performance; management reported Gallileo cash occupancy effectively near full (c.97–98%) following handovers.
- Operating Cost Certainty via HedgingEnergy rates for Singapore portfolio hedged through mid‑2027, and management expects meaningful electricity tariff reductions (similar to group commentary) to reduce operating cost pressure.
CPAMF Earnings History
| Report Date | Fiscal Quarter | Forecast / EPS | Last Year's EPS | EPS YoY Change | Press Release |
|---|---|---|---|---|---|
| Jul 28, 2027 | 2027 (Q2) | ―- | 0.07 | ― | ― |
| Oct 29, 2026 | 2026 (Q3) | ―- | 0.04 | ― | |
| Aug 11, 2026 | 2026 (Q2) | ―0.07 | 0.04 | 63.64% (+0.03) | |
| Feb 05, 2026 | 2025 (Q4) | ―0.06 | 0.06 | -12.35% (-0.01) | |
| Oct 28, 2025 | 2025 (Q3) | ―- | 0.04 | ― | |
| Aug 04, 2025 | 2025 (Q2) | ―0.04 | 0.04 | 1.85% (+0.00) | |
| Feb 05, 2025 | 2024 (Q4) | ―0.06 | 0.06 | 14.08% (+0.01) | |
| Nov 05, 2024 | 2024 (Q3) | ―- | 0.05 | ― | |
| Aug 13, 2024 | 2024 (Q2) | ―0.04 | 0.05 | -6.90% (-0.00) | |
| Apr 25, 2024 | 2024 (Q1) | ―- | 0.04 | ― |
The table shows recent earnings report dates and whether the forecast was beat or missed. See the change in forecast and EPS from the previous year.
