

China Construction Bank (CICHF) Q2 2026 Earnings Report
CICHF Q2 2026 EPS Results
- Actual EPS
- $0.05
- Consensus EPS
- $0.05
- Beat/Miss
- Beat by +$0.00
- One Year Ago EPS
- $0.05
CICHF Q2 2026 Revenue Results
- Actual Revenue
- $52.82B
- Expected Revenue
- $31.73B
- Beat/Miss
- Beat by +$21.08B
- YoY Revenue Growth
- +8.47%
Earnings Announcement Details
- Quarter
- Q2 2026
- Date
- 08/28/2026
- Time
- Before Open
- Conference Call
- Friday, August 28, 2026
China Construction Bank's next earnings date is estimated for April 1, 2027, based on past reporting schedules.
Q2 2026 Earnings Call Audio
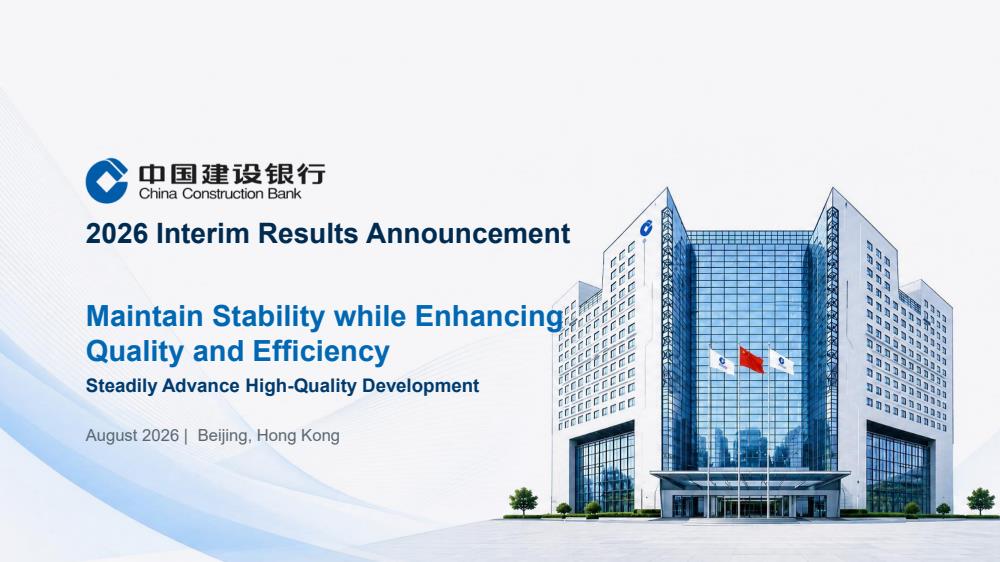
Q2 2026 Earnings Slide Deck
Q2 2026 Earnings Call Summary
The call presented a largely positive operational and financial picture: robust top-line growth, improving margins, solid cost efficiency, strong loan growth in targeted sectors (manufacturing, private enterprises), growing wealth and custody businesses, active international expansion, and broad AI/digital adoption. Asset quality metrics remain stable and capital ratios are strong, enabling dividends and orderly capital issuance. Management did, however, acknowledge macroeconomic and market challenges — notably a low-rate environment and potential retail/consumer pressures — and emphasized prudent risk management and readiness for downside scenarios. On balance, the positives (revenue, margin, efficiency, product and digital execution, capital strength) outweigh the cited risks, though the bank is clearly focused on mitigating macro- and market-related headwinds.
CCB guided that H2 will prioritize five areas (technology finance, green, inclusive, pension and digital), deepen support for the real economy, optimize asset‑liability and bond duration, grow net interest and non‑interest income, accelerate AI/digital deployment and tighten risk/compliance while executing orderly capital replenishment. Management framed that guidance with H1 metrics: operating income CNY426bn, pre‑provision profit CNY328bn (double‑digit YoY), net profit CNY171bn (+5.56%), NIM 1.37%, ROA 0.74%, ROE 9.52%, CAR 19.42% (Core Tier‑1 14.24%), cost‑to‑income 22.17%, loans CNY29.34tn, financial investments CNY13.99tn, net interest income CNY115bn (+16.31%), NPL ratio 1.29% with provision coverage ≈239%, interim dividend RMB2.01/10 shares (total CNY52.58bn; payout ratio 31%), personal customers 592m, personal AUM CNY24tn, wealth AUM >CNY5.3tn, green loans CNY6.53tn (+8.95%), manufacturing loans CNY4tn (+17.5%), private enterprise loans CNY7.36tn (+9.42%) and international loans CNY2tn (+24.57%).
- Strong Top-Line and Pre-Provision Profit GrowthOperating income of CNY 426 billion and profit before provision of CNY 328 billion, with operating revenue and pre-provision profit reported as growing in double digits year-on-year (operational revenue up ~10.48% and profit before provision up ~13% YoY per management commentary).
- Net Profit and Capital PositionNet profit of CNY 171 billion, up 5.56% YoY. Capital adequacy ratio remains robust at 19.42% and Core Tier 1 CAR at 14.24%; bank emphasized organic capital growth and issued capital instruments (e.g., CNY 30 billion perpetual, CNY 60 billion Tier 2, CNY 60 billion TLAC).
- Improved Net Interest Income and MarginNet interest income reported at CNY 115 billion, up ~16.3% YoY; NIM at 1.37% (up a few basis points YoY and sequentially) driven by active asset-liability management, growth in higher-yielding assets and optimized funding mix.
- Efficiency and Expense ControlCost-to-income ratio improved to 22.17%, down ~1.55 percentage points YoY (management describes this as industry-leading), reflecting disciplined expense control and tech-led operating efficiencies.
- Asset Growth and Loan Book CompositionLoan book around CNY 29–29.34 trillion (loan scale up CNY 1.5 trillion, ~5.65% growth YoY). Corporate loans ~CNY 20 trillion (up ~8.2%) and retail loans ~CNY 9.19 trillion (~31% of loans). Increased lending to manufacturing (CNY 4 trillion, +~17.5%) and private enterprises (CNY 7.36 trillion, +~9.4%).
- Wealth, Custody and Intermediary Business MomentumWealth management scale > CNY 5.3 trillion; wealth customers added ~5.57 million. Assets under custody reported at ~CNY 25+ trillion. Fee and commission / intermediary income strong (fee income cited at CNY 68 billion and key businesses contributing double-digit growth).
- Green, Tech and Inclusive Finance ProgressGreen loan balance CNY 6.53 trillion (+8.95% YoY). Technology-related lending realized double-digit growth with 87 tranches issued. Inclusive finance: served ~3.82 million micro/small enterprise customers; corporate pension Pillar 2 AUM ~CNY 800 billion (+10.7%); corporate pension accounts +33%.
- International and Overseas PerformanceInternational business loan balance ~CNY 2 trillion (+24.57% YoY). Overseas branches/subsidiaries reported positive results: overseas branches net revenue CNY 9.5 billion (+21.87% YoY) and subsidiaries net profit CNY 18.2 billion (+28.95% YoY).
- AI and Digital DeploymentExtensive AI adoption across >600 scenarios and ~600+ AI-powered applications; example metrics include an AI assistant with ~40,000 monthly active users and >90 million interactions; reported uplift in new AUM via AI tool by ~57% and faster processing times for inclusive finance cases (hours vs days).
- Shareholder ReturnsProposed interim cash dividend RMB 2.01 per 10 shares (total ~CNY 52.582 billion) and increase of dividend payout ratio from 30% to 31%, reflecting continued focus on shareholder returns.
CICHF Earnings History
| Report Date | Fiscal Quarter | Forecast / EPS | Last Year's EPS | EPS YoY Change | Press Release |
|---|---|---|---|---|---|
| Apr 01, 2027 | 2026 (Q4) | 0.05- | 0.05 | ― | ― |
| Oct 30, 2026 | 2026 (Q3) | 0.060.06 | 0.05 | 8.57% (+0.00) | |
| Aug 28, 2026 | 2026 (Q2) | 0.050.05 | 0.05 | 6.67% (+0.00) | |
| Apr 29, 2026 | 2026 (Q1) | 0.050.05 | 0.05 | 0.00% (+0.00) | |
| Mar 27, 2026 | 2025 (Q4) | 0.050.05 | 0.05 | -3.13% (-0.00) | |
| Oct 30, 2025 | 2025 (Q3) | 0.050.05 | 0.05 | 9.38% (+0.00) | |
| Aug 29, 2025 | 2025 (Q2) | 0.050.05 | 0.05 | -3.23% (-0.00) | |
| Apr 29, 2025 | 2025 (Q1) | 0.050.05 | 0.05 | -5.71% (-0.00) | |
| Mar 28, 2025 | 2024 (Q4) | 0.050.05 | 0.05 | 3.23% (+0.00) | |
| Oct 30, 2024 | 2024 (Q3) | 0.050.05 | 0.05 | -8.57% (-0.00) |
The table shows recent earnings report dates and whether the forecast was beat or missed. See the change in forecast and EPS from the previous year.