

Hexagon Composites (2HX) Q2 2026 Earnings Report
CH:2HX Q2 2026 EPS Results
- Actual EPS
- -CHF 0.01
- Consensus EPS
- -CHF 0.02
- Beat/Miss
- Beat by +CHF 0.01
- One Year Ago EPS
- -CHF 0.07
CH:2HX Q2 2026 Revenue Results
- Actual Revenue
- CHF 56.05M
- Expected Revenue
- CHF 63.44M
- Beat/Miss
- Missed by -CHF 7.39M
- YoY Revenue Growth
- -6.82%
Earnings Announcement Details
- Quarter
- Q2 2026
- Date
- 08/06/2026
- Time
- Before Open
- Conference Call
- Thursday, August 6, 2026
Hexagon Composites's next earnings date is estimated for November 6, 2026, based on past reporting schedules.
Q2 2026 Earnings Call Audio
Q2 2026 Earnings Slide Deck
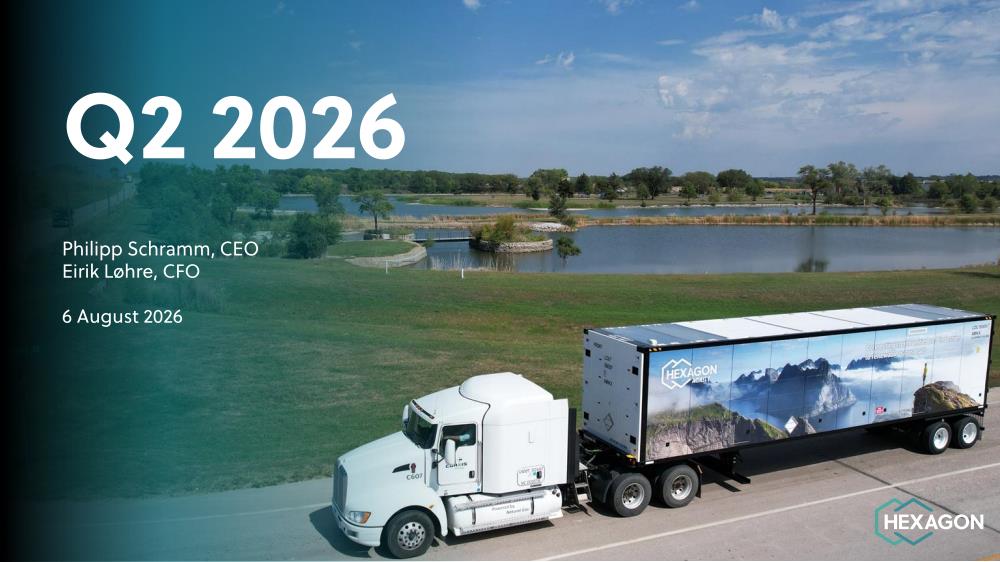
Q2 2026 Earnings Call Summary
The call presented multiple meaningful strategic and financial improvements: completion of a cost reduction program, a NOK 650 million equity raise, a record USD 100 million Mobile Pipeline order (entering data center power generation), an exclusive IVECO BUS agreement, improved liquidity and a clear EBITDA step-up with raised full-year guidance to ~NOK 300 million. Offsetting these positives are continued lumpiness in Mobile Pipeline, cautious customer CapEx behavior, aftermarket softness, potential input-cost and mix pressures that could compress margins in H2, and some uncertainty around minority exposure to Hexagon Purus. On balance, the operational progress, balance sheet strengthening and high-profile commercial wins outweigh the near-term execution and market risks.
Management guided that 2026 revenue should be “moderately above last year” and raised full‑year EBITDA guidance from “above NOK 200m” to around NOK 300m, expecting the second half to be stronger than H1 and an improving base in 2027; this outlook is supported by Q2 revenue of NOK 627m (H1 ~NOK 1.3bn), Q2 EBITDA NOK 69m (11% margin) and H1 EBITDA NOK 126m (10% margin). Segment and order metrics cited include Fuel Systems Q2 revenue NOK 450m and EBITDA NOK 78m (17% margin), Mobile Pipeline Q2 revenue NOK 101m with a July Certarus order of USD 100m (~NOK 1bn) plus a ~$25m option through 2028 expected to drive H2/2027, and Aftermarket Q2 revenue NOK 98m with EBITDA NOK 11m. Management also pointed to strengthened liquidity and capital structure—NOK 650m equity raise, gross debt end‑Q2 NOK 972m, cash NOK 294m, net interest‑bearing debt NOK 678m (pro forma NOK 576m after the repair offering), available liquidity NOK 694m (pro forma NOK 796m), Q2 operating cash flow NOK 128m and net cash flow NOK 115m—plus low YTD CapEx ~NOK 20m (NOK 12m in Q2) versus full‑year guidance NOK 70–80m, and structural cost actions (≈25% headcount reduction, ~NOK 260m lower personnel/SG&A with underlying savings ~NOK 120m, ~NOK 60m working‑capital release) and a recent COGS level around 42% as reasons supporting the higher EBITDA target.
- Completed cost reduction programHeadcount reduced by ~25%; personnel and SG&A reduced by ~NOK 260 million with an underlying structural saving of ~NOK 120 million; CapEx disciplined and core working capital release of ~NOK 60 million, structurally lowering the cost base.
- Strengthened balance sheet via equity raiseCompleted NOK 650 million equity raise; pro forma net interest-bearing debt reduced from just under NOK 1.3 billion to NOK 576 million (≈NOK 724 million reduction, ~56%); available liquidity improved from NOK 528 million to NOK 796 million pro forma (increase ~NOK 268 million, ~51%).
- Record Mobile Pipeline order and new data center market entrySigned the largest Mobile Pipeline order in company history: USD 100 million (~NOK 1 billion) with Certarus plus an option of ~USD 25 million to 2028; marks first confirmed entry into data center power generation as a new end market.
- Exclusive long-term agreement with IVECO BUSSecured a 3-year exclusive supply agreement to be the fuel system and cylinder supplier across IVECO BUS's global CNG bus platform, reinforcing leadership in European transit markets.
- Improved quarterly revenue and substantial EBITDA upliftGroup revenue of NOK 627 million in Q2 2026 (broadly steady vs Q1 on an FX-adjusted basis); Q2 EBITDA of NOK 69 million representing an 11% margin — an improvement of NOK 57 million from the low point a year earlier and a 9 percentage point margin increase year-over-year.
- Strong Fuel Systems performanceFuel Systems revenue NOK 450 million and EBITDA NOK 78 million in Q2 (17% margin) — the best Fuel Systems EBITDA quarter since Q4 2024, supported by transit, sleeper cab deliveries to Mexico, aerospace and specialized deliveries.
- Cash generation and liquidity improvementsCash flow from operations of NOK 128 million in Q2 and net cash flow of NOK 115 million for the quarter (includes equity proceeds and discontinued operations items); gross debt NOK 972 million and cash NOK 294 million at quarter-end (pro forma liquidity NOK 796 million).
- Raised full-year EBITDA guidanceManagement raised full-year EBITDA guidance from 'above NOK 200 million' to around NOK 300 million, citing structural cost savings, improved profitability and stronger market visibility.
- Low CapEx and disciplined spendingYTD CapEx of ~NOK 20 million (NOK 12 million in Q2) against full-year guidance of NOK 70–80 million, highlighting capital discipline.
- Aftermarket and refurbishment tractionAftermarket revenue NOK 98 million and EBITDA NOK 11 million; certified preowned and refurbishment offerings gaining traction as first-generation systems reach end-of-life, supporting margin recovery.
CH:2HX Earnings History
| Report Date | Fiscal Quarter | Forecast / EPS | Last Year's EPS | EPS YoY Change | Press Release |
|---|---|---|---|---|---|
| Nov 06, 2026 | 2026 (Q3) | -0.01- | -0.07 | ― | ― |
| Aug 06, 2026 | 2026 (Q2) | -0.02-0.01 | -0.07 | 87.01% (+0.06) | |
| May 13, 2026 | 2026 (Q1) | -0.04-0.04 | -0.23 | 83.40% (+0.19) | |
| Feb 12, 2026 | 2025 (Q4) | -0.04-0.01 | -0.28 | 97.57% (+0.27) | |
| Nov 06, 2025 | 2025 (Q3) | -0.06-0.07 | 0 | -8100.00% (-0.07) | |
| Aug 14, 2025 | 2025 (Q2) | -0.04-0.07 | -0.04 | -60.42% (-0.03) | |
| May 15, 2025 | 2025 (Q1) | -0.06-0.23 | -0.07 | -227.37% (-0.16) | |
| Feb 13, 2025 | 2024 (Q4) | 0.01-0.28 | -0.35 | 20.72% (+0.07) | |
| Nov 07, 2024 | 2024 (Q3) | 0.000.00 | -0.07 | 101.21% (+0.07) | |
| Aug 15, 2024 | 2024 (Q2) | -0.02-0.04 | 1 | -104.29% (-1.05) |
The table shows recent earnings report dates and whether the forecast was beat or missed. See the change in forecast and EPS from the previous year.
