

Breville Group (BVILF) Q4 2026 Earnings Report
BVILF Q4 2026 EPS Results
- Actual EPS
- $0.19
- Consensus EPS
- $0.20
- Beat/Miss
- Missed by -$0.01
- One Year Ago EPS
- $0.19
BVILF Q4 2026 Revenue Results
- Actual Revenue
- $510.07M
- Expected Revenue
- $531.36M
- Beat/Miss
- Missed by -$21.29M
- YoY Revenue Growth
- +1.88%
Earnings Announcement Details
- Quarter
- Q4 2026
- Date
- 08/18/2026
- Time
- After Close
- Conference Call
- Tuesday, August 18, 2026
Breville Group 's next earnings date is estimated for February 15, 2027, based on past reporting schedules.
Q4 2026 Earnings Call Audio
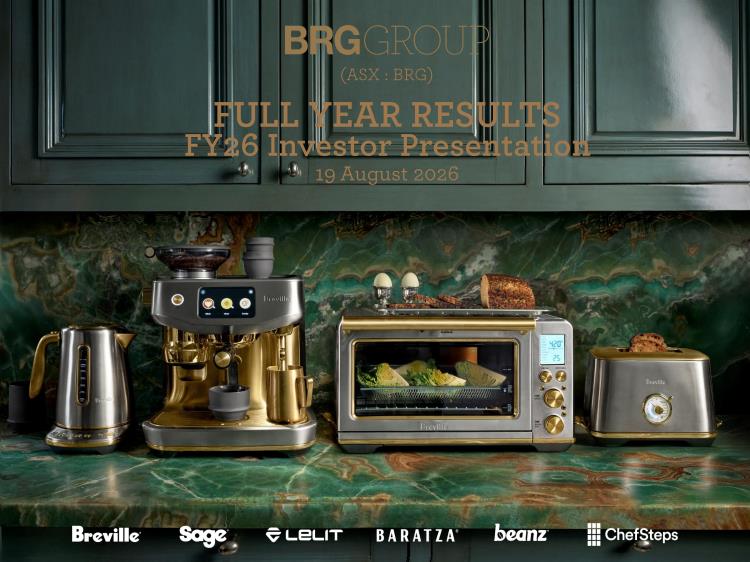
Q4 2026 Earnings Slide Deck
Q4 2026 Earnings Call Summary
The call portrayed a predominantly positive operational and strategic position: record revenues (> $1.8B), broad-based constant currency growth (9.7%), strong retail execution (Best Buy), successful manufacturing diversification (85% of 120V GP dollars outside China), rapid expansion of new direct markets (74% growth), a solid balance sheet (net cash $104.4M), and meaningful AI‑driven productivity gains (e.g., 6.3x recipe production improvement). Offsetting these positives were persistent near‑term headwinds — tariff complexity and refunds/provisions, commodity inflation from Middle East tensions, elevated inventory (~$40M) tied to the manufacturing transition, and only 1.2% EBIT growth (below the company's normal target). Management emphasized readiness, continued investment in growth, and improving second‑half margins, indicating the positives materially outweigh the transitory challenges.
Management gave no numeric FY‑27 targets on the call, saying formal guidance will be provided with the FY‑27 first half results, but outlined the planning assumptions and financial capacity: the group starts FY‑27 in a net cash position of $104.4m with significant unused debt facilities and will continue to use cash flow and the balance sheet to invest in growth assets and inventory as a mitigant to uncertainty. They noted FY‑26 delivered sales of over $1.8bn, EBIT of $207m (in line with budget/guidance), FY‑26 gross margin 36.0% (H2 margin 36.8% vs FY‑25 36.6%), global constant‑currency revenue growth 9.7% (reported AUD growth 6.7%), and highlighted structural tailwinds to FY‑27 (manufacturing diversification — 85% of 120V gross profit dollars sourced outside China, localization, annualization of 300 Best Buy store‑in‑store installs) while flagging material downside risks from a fluid U.S. tariff outlook and oil‑related inflation; they also said the IEEPA cash refund of $59.6m and related $55.2m provision leave only a minimal net FY‑26 profit impact.
- Record Annual SalesReported sales of over $1.8 billion for FY '26, with constant currency revenue growth of 9.7% and reported AUD revenue growth of 6.7% (FX dampening effect). Second half strengthened to double-digit growth in constant currency.
- Strong Category Performance — Coffee and CookingCoffee and Cooking delivered double-digit revenue growth in constant currency across the year; Food Preparation grew in single digits. Americas Coffee led growth with premium NPD and strong Barista Express performance.
- Geographic Momentum — Americas, EMEA, APACAmericas revenue grew 10.8% in constant currency. EMEA direct markets and U.K./EU/Middle East grew double digits. APAC grew 8.3% for FY '26 with second‑half strengthening to 11.5%.
- Rapid Expansion of New Direct MarketsNew direct markets (Mexico, Middle East, South Korea, China) collectively grew 74% YoY. China delivered 7.1x the revenue of the previous distributor in its first year and the Middle East 6.6x — strong first‑year conversion outcomes.
- Manufacturing Diversification AchievedCompleted substantial manufacturing diversification: 85% of 120‑volt gross profit dollars now sourced outside China, providing greater optionality to withstand tariff and supply volatility.
- Gross Margin Improvement in Second HalfGroup gross margin finished the year at 36.0% (FY '25: 36.6%) with second‑half margin improvement to 36.8%, reflecting benefits from the diversified sourcing mix.
- EBIT and Cash PositionReported EBIT of $207 million, delivered in line with budget and guidance. Strengthened net cash position of $104.4 million supported by healthy underlying cash flow.
- Retail Execution — Best Buy Store‑in‑StoreRolled out 300 Best Buy store‑in‑store installations (Nov rollout) leading to material step‑up in store performance and average selling price; Best Buy requested expansion to additional doors.
- Distribution Segment ContributionDistribution segment fulfilled strategic role, delivering $4 million of incremental gross profit for the year.
- Significant AI‑Driven Productivity GainsAI transformation progress: >50% of employees 'amplified' using AI tools; recipe application produced 660 machine‑specific recipes in 67 hours vs an estimated 425 hours pre‑AI (6.3x improvement); UX design app yields 5x faster consumer‑tested prototypes and 2–3 months earlier firmware handoffs.
- New Product Success and NPD PipelineNew products (Oracle Dual Boiler, EyeQ Toaster, Baratza Encore ESP Pro, Lelit MaraX3) performed strongly. Management described the strongest NPD pipeline seen in recent years with product releases ramping from H1 FY '27 onwards.
- Solution Expansion — Beanz and NFC Coffee ExperienceBeanz launched in the Netherlands with cross‑border VAT solution (26 roasters: 12 NL, 14 DE) and Fast Track Barista to go live in September; global NFC coffee experience to launch across 17 machines, 17 languages and 40 countries, powered by AI applications.
BVILF Earnings History
| Report Date | Fiscal Quarter | Forecast / EPS | Last Year's EPS | EPS YoY Change | Press Release |
|---|---|---|---|---|---|
| Feb 15, 2027 | 2027 (Q2) | 0.54- | 0.48 | ― | ― |
| Aug 18, 2026 | 2026 (Q4) | 0.200.19 | 0.19 | 1.50% (+0.00) | |
| Feb 11, 2026 | 2026 (Q2) | 0.480.48 | 0.48 | 0.30% (+0.00) | |
| Aug 19, 2025 | 2025 (Q4) | 0.170.19 | 0.17 | 10.83% (+0.02) | |
| Feb 10, 2025 | 2025 (Q2) | 0.480.48 | 0.42 | 14.95% (+0.06) | |
| Aug 20, 2024 | 2024 (Q4) | 0.160.17 | 0.16 | 9.59% (+0.02) | |
| Feb 12, 2024 | 2024 (Q2) | 0.430.42 | 0.4 | 4.86% (+0.02) | |
| Aug 20, 2023 | 2023 (Q4) | 0.150.16 | 0.14 | 9.50% (+0.01) | |
| Feb 13, 2023 | 2023 (Q2) | 0.410.40 | 0.4 | 0.18% (+0.00) | |
| Aug 22, 2022 | 2022 (Q4) | 0.200.14 | 0.14 | 4.71% (+0.01) |
The table shows recent earnings report dates and whether the forecast was beat or missed. See the change in forecast and EPS from the previous year.
