


Brandywine Realty earnings date
Want to see BDN full AI Analyst Report?
Brandywine Realty (BDN) Q3 2026 Earnings Report
BDN Q3 2026 EPS Results
- Actual EPS
- $0.40
- Consensus EPS
- -$0.17
- Beat/Miss
- Beat by +$0.57
- One Year Ago EPS
- -$0.15
BDN Q3 2026 Revenue Results
- Actual Revenue
- $125.64M
- Expected Revenue
- $111.49M
- Beat/Miss
- Beat by +$14.15M
- YoY Revenue Growth
- +3.48%
Earnings Announcement Details
- Quarter
- Q3 2026
- Date
- 10/21/2026
- Time
- After Close
- Conference Call
- Wednesday, October 21, 2026
Brandywine Realty's next earnings date is estimated for February 3, 2027, based on past reporting schedules.
Q3 2026 Earnings Call Audio
Q3 2026 Earnings Slide Deck
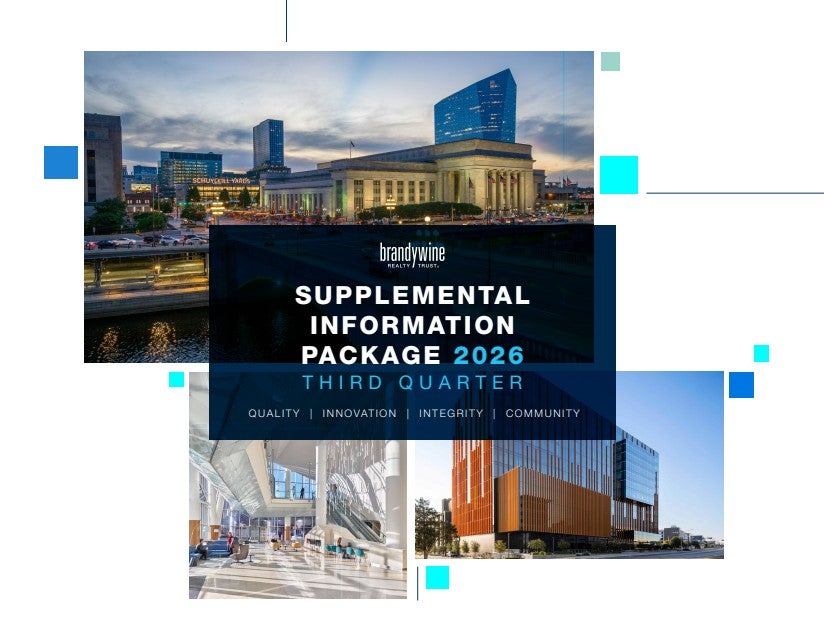
Q3 2026 Earnings Call Summary
The call was predominantly positive, with management reporting that the 2026 sales program was fully achieved, debt reduction significantly exceeded the original target, liquidity improved, leasing activity strengthened, and leverage metrics moved lower. The company also outlined additional deleveraging, redevelopment, recapitalization, and disposition plans. Offsetting concerns included the quarterly net loss, lower-than-forecast property NOI, negative GAAP same-store results, low Austin occupancy, elevated CAD payout, the upcoming IBM NOI loss, debt-extinguishment charges, and continued market volatility. Highlights significantly outweighed the lowlights.
Brandywine is maintaining its $0.55 per share full year midpoint and has narrowed its full year FFO guidance range; 2026 sales guidance is $681 million, speculative revenue is $19.5 million, year-end net debt to EBITDA is expected at 7.8x-8x, tenant retention guidance is 54%, the 2026 business plan capital ratio range is 11%-12%, and full year GAAP mark to market guidance is 5%-6%. Year-end occupancy and lease percentages will improve through year-end, with positive net absorption expected for the first time in several years. Fourth quarter core FFO guidance is $0.16-$0.18 per share, property level income should be about $68 million, G&A expense about $7 million, full year G&A expense $36 million-$37 million, interest expense approximately $35 million, the fourth quarter capital market plan about $165 million, net debt EBITDA 7.8-8.0, and the fixed charge ratio between 1.8 and 2.0. The company expects to use another $100 million of cash on hand to further reduce debt during the fourth quarter, anticipates about another $200 million, maybe more in sales next year, expects the One Uptown recapitalization in the first quarter of 2027 to provide about $25 million in net proceeds and reduce debt attribution by about $50 million in 2027, and is targeting redevelopment returns of mid 8%-9% and dividend coverage between 70% and 90%.
- 2026 Sales Guidance Increased and Fully AchievedThe company increased its 2026 sales guidance from $305 million to $681 million and stated that the sales target was 100% achieved and fully funded. The result was highlighted by the $240 million sale of 3151 Market Street at $544 per square foot and the sale of the partnership interest in Solaris House.
- 3151 Market Street Sale Reduced Future Capital CommitmentsThe $240 million 3151 Market Street sale eliminated almost $80 million of forward capital spend. Management said the decision generated liquidity, eliminated the lag time to stabilize the property, and enabled proceeds to be redeployed toward higher-cost debt.
- Speculative Revenue Target Raised and AchievedThe speculative revenue target was increased by an additional $1 million to $19.5 million, was 100% achieved, and was described as having basically nothing left to do for the balance of 2026. The target is now almost 12% higher than the initial 2026 business plan.
- Third-Quarter FFO Met GuidanceThird-quarter FFO was $0.14 per diluted share, in line with management guidance and consensus estimates. The company maintained its $0.55 per share full-year midpoint and narrowed its full-year FFO guidance range.
- Accelerated Debt Reduction and Lower LeverageThe company reduced debt by $390 million, or more than 13% of outstanding combined debt, which was $218 million above its initial 2026 debt-reduction target. The year-end net debt-to-EBITDA midpoint was lowered from 8.4x-8.8x to 7.8x-8.0x, an approximately 8% midpoint reduction, while quarterly annualized net debt-to-EBITDA declined from 9.0x in the second quarter to 7.6x.
- Interest Savings from Debt RepurchasesThe company purchased $140 million of unsecured bonds, including $50 million of 2028 bonds and $90 million of 2029 bonds, reducing annual interest expense by $12.5 million. Total third-quarter debt reduction, including the line of credit, produced $24 million of annual interest expense savings on a wholly owned basis.
- Improved Liquidity PositionAfter receiving quarter-end sale proceeds, the company paid off the $137 million line-of-credit balance in early October. It reported $175 million of cash on hand and no outstanding balance on its unsecured line of credit at the time of the call.
- Strong Leasing Activity and Improved Occupancy OutlookThird-quarter leasing activity was the highest of the year at 558,000 square feet, including 372,000 square feet in the wholly owned portfolio. Forward leasing commencing after the quarter totaled 163,000 square feet, with 111,000 square feet taking occupancy in 2026. Management expects year-end occupancy and lease percentages to improve and positive net absorption for the first time in several years.
- One Uptown Reached 97% LeasedThe company leased approximately 114,000 square feet at One Uptown since the prior call, bringing the property to 97% leased. Management expects the project to stabilize in the third quarter, slightly behind schedule because of tenant build-out times, but at a slightly higher pro forma yield.
- Improved Tenant RetentionTenant retention was 50% for the quarter, and the company raised its full-year midpoint retention target to 54%. The increase was mainly attributed to unbudgeted renewals and expansions in the Philadelphia CBD and Pennsylvania markets.
- Positive Leasing Economics and Narrowed GuidanceThe quarterly capital ratio was 8.9%, allowing the company to narrow and lower its 2026 business plan range from 12%-13% to 11%-12%. GAAP mark-to-market was 10.8%, and full-year guidance was narrowed to 5%-6% from 5%-7%; cash mark-to-market was 5.7%.
- Strong Tour Conversion RatesTour volume remained very strong in the third quarter, with higher volumes in the CBD and University City markets. For the trailing four quarters, 54% of tours converted to proposals and 49% of proposals converted to executed leases, with both rates ahead of historical averages.
- Philadelphia Portfolio OutperformancePhiladelphia was 95% occupied and 96% leased, with only 7% rolling annually through 2028. During the first nine months of the year, 60% of all new leasing signed in the Philadelphia CBD and University City submarkets was at a Brandywine property, compared with a 15% market share. Office-to-residential conversion activity in the Philadelphia CBD now aggregates more than 5 million square feet, or about 11% of inventory.
- Pennsylvania Suburban Leasing PositionThe Pennsylvania suburban portfolio was 93% leased, with solid pipeline prospects for existing vacancies, particularly in the Radnor submarket.
- Large and Stable Leasing PipelineThe operating portfolio leasing pipeline remained stable at 2 million square feet, including approximately 300,000 square feet in very advanced stages of negotiation.
- Successful Solaris Sale and Joint-Venture ProgressThe company completed the sale of Solaris, its 340-unit Austin residential project, in September at a sub-4% cap rate. It received net proceeds after repaying the $76 million construction loan and the preferred investor; the company owned approximately 57% of the joint venture. Management also said it had made significant progress toward recapitalizing its remaining preferred-equity development projects.
- Strong Execution of Asset SalesManagement said all transactions closed on schedule without any retrade of pricing despite choppy capital markets. Marketing processes typically generated 7 to 10 qualified bids, with interest from users, institutional investment managers, private REITs, and private capital.
- Uptown Redevelopment PipelineIn anticipation of the 2027 IBM lease expiration, the company has a redevelopment pipeline of approximately 1.5 million square feet, with prospects having lease commencement dates between late 2027 and 2030. The first planned building is 157,000 square feet, and management expects to deliver a renovated building by year-end 2027 if pre-leasing is achieved. Planned projects are expected to deliver a mid-8%-9% return on cost.
- Potential One Uptown RecapitalizationWith One Uptown 97% leased, the company plans to explore a recapitalization in the first quarter of 2027. Management expects the transaction to provide approximately $25 million in net proceeds and reduce debt attribution by about $50 million in 2027.
- Future Deleveraging and Disposition PlansThe company expects to use another $100 million of cash on hand to reduce debt during the fourth quarter, targeting year-end net debt-to-EBITDA of 7.8x-8.0x and a fixed-charge ratio of 1.8x-2.0x. Management also anticipates approximately another $200 million or more of sales in 2027, potentially including in-market assets, non-core-market assets, and land parcels.
- Austin Development and Conversion PlanningManagement identified Uptown ATX as its primary Austin focus and said the nearby train station is expected to be fully operational early next year. The company is evaluating converting one River Place pod to residential development under legislation that accelerates office-to-residential conversions. Planning is also underway for Blocks B and D, primarily retail and multifamily with a potential hospitality component, but execution is contingent on firm lease and financial commitments.
BDN Earnings History
| Report Date | Fiscal Quarter | Forecast / EPS | Last Year's EPS | EPS YoY Change | Press Release |
|---|---|---|---|---|---|
| Feb 03, 2027 | 2026 (Q4) | -0.13- | -0.21 | ― | ― |
| Oct 21, 2026 | 2026 (Q3) | -0.170.40 | -0.15 | 368.67% (+0.55) | |
| Jul 22, 2026 | 2026 (Q2) | -0.180.44 | -0.51 | 186.08% (+0.95) | |
| Apr 22, 2026 | 2026 (Q1) | -0.20-0.28 | -0.16 | -75.00% (-0.12) | |
| Feb 03, 2026 | 2025 (Q4) | -0.23-0.21 | -0.25 | 16.00% (+0.04) | |
| Oct 22, 2025 | 2025 (Q3) | -0.14-0.15 | -0.96 | 84.38% (+0.81) | |
| Jul 23, 2025 | 2025 (Q2) | -0.16-0.51 | 0.17 | -400.00% (-0.68) | |
| Apr 22, 2025 | 2025 (Q1) | -0.18-0.16 | -0.1 | -60.00% (-0.06) | |
| Feb 04, 2025 | 2024 (Q4) | -0.07-0.25 | -0.91 | 72.53% (+0.66) | |
| Oct 22, 2024 | 2024 (Q3) | -0.07-0.96 | -0.13 | -638.46% (-0.83) |
The table shows recent earnings report dates and whether the forecast was beat or missed. See the change in forecast and EPS from the previous year.
