

Want to see BCIC full AI Analyst Report?
BCP Investment Corporation (BCIC) Q2 2026 Earnings Report
BCIC Q2 2026 EPS Results
- Actual EPS
- $0.45
- Consensus EPS
- $0.41
- Beat/Miss
- Beat by +$0.04
- One Year Ago EPS
- $0.50
BCIC Q2 2026 Revenue Results
- Actual Revenue
- $4.68M
- Expected Revenue
- $15.21M
- Beat/Miss
- Missed by -$10.53M
- YoY Revenue Growth
- -245.89%
Earnings Announcement Details
- Quarter
- Q2 2026
- Date
- 08/06/2026
- Time
- After Close
- Conference Call
- Thursday, August 6, 2026
BCP Investment Corporation's next earnings date is estimated for November 5, 2026, based on past reporting schedules.
Q2 2026 Earnings Call Audio
Q2 2026 Earnings Slide Deck
Q2 2026 Earnings Call Summary
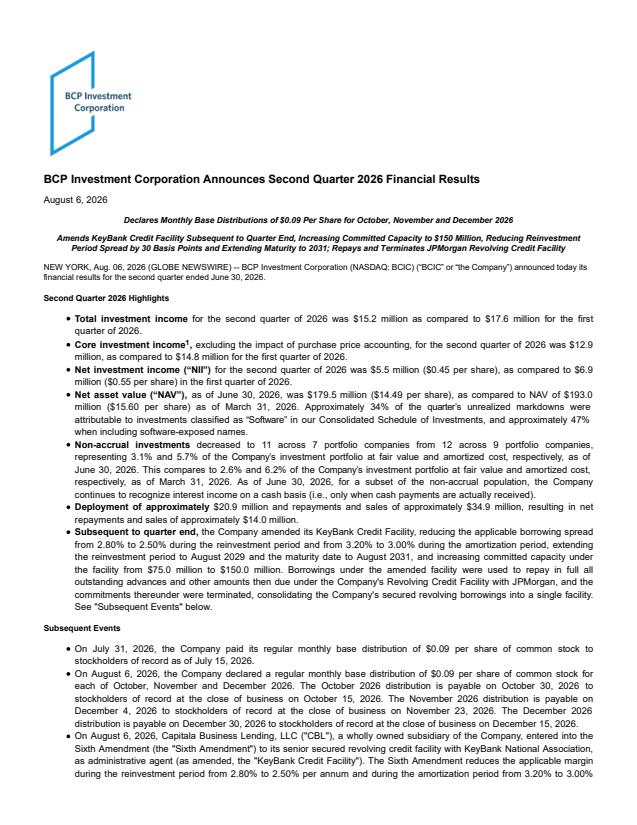
The company made clear progress on balance sheet strengthening and liability management — reducing leverage, improving asset coverage, increasing committed borrowing capacity, and maintaining distribution coverage — while preserving a disciplined, selective deployment approach with attractive yields. Offsetting these positives were a meaningful NAV contraction driven by unrealized mark-to-market markdowns (notably concentrated in software), a substantial $10.5 million realized loss from legacy positions, and quarter-over-quarter declines in investment income and NII. Market dislocation (especially in software) and lower transaction volumes limited deployment and pressured valuation. Overall, the call presents a balanced picture of operational and capital-strength improvements tempered by valuation-driven NAV declines and realized losses.
Management's guidance for the second half of 2026 emphasized active portfolio management, disciplined underwriting, prudent capital allocation, and not relying on a market-wide M&A recovery while remaining selective on new deployment and continuing to deleverage. Key metrics cited: Q2 total investment income $15.2M, core investment income $12.9M, net investment income $5.5M ($0.45/sh) and core NII $3.3M ($0.27/sh) (covering the $0.27 base distribution paid monthly at $0.09 and total Q2 distributions of $0.30); NAV declined to $179.5M ($14.49/sh) from $193M ($15.60/sh); par borrowings fell $56M to $286.1M with gross/net leverage at 1.6x (from 1.8x/1.5x) and asset coverage improving to 162% (from 156%); weighted average borrowing rate ~7% and $86M of available capacity at quarter-end, with a KeyBank amendment reducing spreads by 30 bps, extending terms and increasing committed capacity from $75M to $150M. Portfolio activity and positioning metrics highlighted for execution: originations $20.9M, repayments/sales $34.9M (net repayments ~$14M), debt portfolio $349.7M FV across 71 companies (avg par ~$3.2M), non-accruals 11 investments/7 companies (3.1% FV / 5.7% cost, down from 12/9 and 2.6%/6.2%), new-debt yield 13.3% (vs. 12.2% WA excl. non-accruals), software accounted for ~34% (47% incl. exposed) of unrealized markdowns while representing <13% of the portfolio with ~93.5% rated low–medium AI impact, and an implied par recovery of $43.2M could equal ~24.1% NAV upside (illustratively ~$2.57/sh or 17.7% under a 10% default / 70% recovery scenario).
- Improved Capital Structure and LiquidityPar borrowings declined by $56.1 million during the quarter to $286.1 million (≈16.4% reduction). Subsequent amendment and upsizing of the KeyBank facility increased committed capacity from $75 million to $150 million, reduced spreads by 30 bps, extended reinvestment period and maturity, consolidated revolving facilities, and increased available borrowing capacity (reported $86 million available at quarter end).
- Reduced Leverage and Stronger Asset CoverageGross and net leverage both declined to 1.6x from 1.8x in the prior quarter (≈11.1% reduction in gross leverage). Asset coverage ratio improved to 162% from 156% (a 6 percentage-point increase).
- Income and Distribution CoverageTotal investment income for the quarter was $15.2 million and core investment income was $12.9 million, both above Q2 2025. Net investment income (NII) was $5.5 million, or $0.45 per share, exceeding the distribution for the period. Core NII of $0.27 per share covered the $0.27 base distribution.
- Active Liability ManagementUsed proceeds from $50 million of 7.5% notes issued in March to redeem $40 million of 2026 notes at par and reduced outstanding revolving borrowings, lowering near-term refinancing risk and improving cost of capital (weighted average contractual interest rate on borrowings ≈7%).
- Improvement in Non-Accruals on a Cost BasisNon-accruals on an amortized cost basis declined to 5.7% from 6.2% the prior quarter; number of portfolio companies on non-accrual fell to 7 from 9. Overall credit performance showed further improvement and two non-accrual positions were resolved during the period.
- Selective Deployment with Attractive YieldsOriginations were measured at $20.9 million with repayments and sales of $34.9 million (net repayments ≈$14 million). Yield on par value of new debt investments was 13.3%, up versus recent weighted-average yields (12.8% as of March 31, 2026), demonstrating selective deployment into higher-yielding opportunities.
- Diversified Debt PortfolioDebt investment portfolio at fair value was $349.7 million (excluding CLOs, equities, JVs) across 71 portfolio companies and 33 industries, average par balance ~$3.2 million, with 79.4% of the accrual debt portfolio comprised of first-lien loans.
- Board Commitment to Distributions and Shareholder CadencePaid total distributions of $0.30 per share in Q2 (base $0.27 + $0.03 supplemental). Board approved Q4 2026 base distribution of $0.27 per share payable monthly ($0.09 per month), supporting consistent monthly payout cadence.
BCIC Earnings History
| Report Date | Fiscal Quarter | Forecast / EPS | Last Year's EPS | EPS YoY Change | Press Release |
|---|---|---|---|---|---|
| Nov 05, 2026 | 2026 (Q3) | 0.36- | 0.7 | ― | ― |
| Aug 06, 2026 | 2026 (Q2) | 0.410.45 | 0.5 | -10.00% (-0.05) | |
| May 07, 2026 | 2026 (Q1) | 0.430.55 | 0.47 | 17.02% (+0.08) | |
| Mar 05, 2026 | 2025 (Q4) | 0.540.57 | 0.6 | -5.00% (-0.03) | |
| Nov 06, 2025 | 2025 (Q3) | 0.510.70 | 0.63 | 11.11% (+0.07) | |
| Aug 07, 2025 | 2025 (Q2) | 0.530.50 | 0.7 | -28.57% (-0.20) | |
| May 08, 2025 | 2025 (Q1) | 0.600.47 | 0.67 | -29.85% (-0.20) | |
| Mar 13, 2025 | 2024 (Q4) | 0.650.60 | 1.19 | -49.58% (-0.59) | |
| Nov 07, 2024 | 2024 (Q3) | 0.680.63 | 0.75 | -16.00% (-0.12) | |
| Aug 08, 2024 | 2024 (Q2) | 0.680.70 | 0.83 | -15.66% (-0.13) |
The table shows recent earnings report dates and whether the forecast was beat or missed. See the change in forecast and EPS from the previous year.
