


Want to see AU:LAU full AI Analyst Report?
Top Page
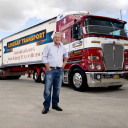
Lindsay Australia Limited
(Sydney:LAU)
Select Model
Select Model
Rating:67Neutral
Price Target:
AU$0.84
▲(8.44% Upside)
Action:Reiterated
Date:08/26/26
The score is driven primarily by solid financial quality (strong revenue growth and improving free cash flow) but is held back by meaningful margin compression and elevated leverage. Valuation is supportive (moderate P/E and strong dividend yield), while technicals show an uptrend but look overbought, tempering the near-term outlook.
Positive Factors
Strong Revenue Growth
Sustained top-line expansion indicates resilient demand across agricultural transport, logistics and rural supplies. Continued growth can improve network utilisation and provide a durable base for earnings, provided pricing and cost control remain effective.
Negative Factors
Material Margin Compression
Falling gross and net margins indicate that revenue growth is not translating proportionally into profit. If pricing, fuel, labour or operating costs remain difficult to recover, sustained margin pressure could constrain earnings and cash-flow growth.
Read all positive and negative factors
Positive Factors
Negative Factors
Strong Revenue Growth
Sustained top-line expansion indicates resilient demand across agricultural transport, logistics and rural supplies. Continued growth can improve network utilisation and provide a durable base for earnings, provided pricing and cost control remain effective.
Read all positive factors
Lindsay Australia Limited (LAU) vs. iShares MSCI Australia ETF (EWA)
Market Cap
AU$267.36M
Dividend Yield4.7%
Average Volume (3M)426.73K
Price to Earnings (P/E)11.9
Beta (1Y)0.81
Revenue Growth26.82%
EPS Growth13.18%
CountryAU
Employees2,511
SectorIndustrials
Sector Strength72
IndustryTrucking
Share Statistics
EPS (TTM)0.06
Shares Outstanding366,251,560
10 Day Avg. Volume608,459
30 Day Avg. Volume426,725
Financial Highlights & Ratios
PEG Ratio0.66
Price to Book (P/B)1.02
Price to Sales (P/S)0.19
P/FCF Ratio3.32
Enterprise Value/Market CapN/A
Enterprise Value/RevenueN/A
Enterprise Value/Gross ProfitN/A
Enterprise Value/EbitdaN/A
Forecast
1Y Price Target
AU$0.95Price Target Upside22.94% Upside
Rating ConsensusStrong Buy
Number of Analyst Covering3
EPS Forecast (FY)0.08
Revenue Forecast (FY)AU$1.10B
Lindsay Australia Limited Business Overview & Revenue Model
Company Description
Established in 1993 and based in Acacia Ridge, Australia, Lindsay Australia Limited delivers an extensive array of integrated transport, logistics, and agricultural supply solutions. The company serves the Australian agriculture, horticulture, and...
How the Company Makes Money
Lindsay Australia Limited makes money primarily by charging customers for logistics and transport services and by selling rural supplies to agricultural customers.
Key revenue streams include:
- Transport and logistics services: Revenue is earned...
Lindsay Australia Limited Financial Statement Overview
Summary
Income Statement
62
Positive
Balance Sheet
55
Neutral
Cash Flow
73
Positive
| Breakdown | Jun 2026 | Jun 2025 | Jun 2024 | Jun 2023 | Jun 2022 |
|---|---|---|---|---|---|
Income Statement | |||||
| Total Revenue | 1.08B | 849.78M | 804.37M | 676.25M | 553.07M |
| Gross Profit | 131.38M | 620.15M | 604.09M | 542.28M | 424.29M |
| EBITDA | 117.68M | 92.23M | 98.48M | 98.28M | 69.75M |
| Net Income | 22.87M | 17.39M | 27.27M | 34.52M | 19.23M |
Balance Sheet | |||||
| Total Assets | 767.23M | 624.12M | 550.05M | 497.35M | 424.07M |
| Cash, Cash Equivalents and Short-Term Investments | 57.75M | 108.98M | 45.56M | 51.97M | 29.04M |
| Total Debt | 373.97M | 320.37M | 247.05M | 234.04M | 205.96M |
| Total Liabilities | 565.43M | 468.66M | 400.69M | 369.98M | 321.16M |
| Stockholders Equity | 201.80M | 155.46M | 149.37M | 127.37M | 102.92M |
Cash Flow | |||||
| Free Cash Flow | 62.03M | 53.28M | 82.14M | 49.48M | 25.83M |
| Operating Cash Flow | 75.21M | 70.69M | 102.71M | 86.00M | 39.63M |
| Investing Cash Flow | -64.95M | -29.09M | -40.52M | -34.11M | -10.64M |
| Financing Cash Flow | -61.48M | 21.82M | -68.60M | -28.96M | -27.54M |
Lindsay Australia Limited Technical Analysis
Positive
0.77
Price Trends
0.68
Positive
0.63
Positive
0.64
Positive
Market Momentum
0.02
Positive
57.24
Neutral
13.33
Positive
Evaluating momentum and price trends is crucial in stock analysis to make informed investment decisions. For AU:LAU, the sentiment is Positive. The current price of 0.77 is above the 20-day moving average (MA) of 0.72, above the 50-day MA of 0.68, and above the 200-day MA of 0.64, indicating a bullish trend. The MACD of 0.02 indicates Positive momentum. The RSI at 57.24 is Neutral, neither overbought nor oversold. The STOCH value of 13.33 is Positive, not indicating any strong overbought or oversold conditions. Overall, these indicators collectively point to a Positive sentiment for AU:LAU.
Lindsay Australia Limited Peers Comparison
UnderperformOutperform
Sector (63)
Name | Overall Rating | Market Cap | P/E Ratio | ROE | Dividend Yield | Revenue Growth | EPS Growth |
|---|---|---|---|---|---|---|---|
67 Neutral | AU$267.36M | 11.90 | 11.42% | 4.70% | 26.82% | 13.18% | |
63 Neutral | $10.79B | 15.43 | 7.44% | 2.01% | 2.89% | -14.66% | |
63 Neutral | AU$187.95M | 15.15 | 19.69% | 4.07% | 8.34% | -6.22% | |
62 Neutral | AU$210.07M | 13.64 | 10.34% | 2.50% | 3.97% | 61.65% | |
62 Neutral | AU$381.18M | 15.94 | 10.64% | 5.50% | 30.67% | -24.67% | |
50 Neutral | AU$124.63M | -110.84 | -1.51% | 2.45% | 42.47% | -144.81% | |
42 Neutral | AU$77.91M | -9.47 | 85.81% | ― | 28.88% | 69.06% |


* Industrials Sector Average
AU:LAU
Lindsay Australia Limited
0.74
0.10
15.44%
AU:FLC
Fluence Corporation Limited
0.08
0.02
35.00%
AU:WAT
Waterco Limited
6.00
-0.21
-3.30%
AU:ACF
Acrow Formwork and Construction Services Limited
0.90
-0.08
-8.26%
AU:KOV
Korvest Ltd.
15.97
3.26
25.68%
AU:SND
Saunders International Limited
0.92
0.17
22.67%
Lindsay Australia Limited Corporate Events
Lindsay Australia Releases FY26 Full-Year Results Presentation
Aug 23, 2026
Lindsay Australia Limited has released its FY26 full-year results presentation for the period ended 30 June 2026, providing investors with an update on the company’s financial and operational performance. The presentation’s publication...
Lindsay Australia breaks $1bn revenue as new Woolworths freight deal lifts growth outlook
Aug 23, 2026
Lindsay Australia has reported record FY2026 results, surpassing $1 billion in revenue as underlying EBIT jumped 37.7% and NPAT rose 31.5%, underpinned by the first full year of SRT Logistics, organic growth in its Transport and Rural divisions, a...
Lindsay Australia Files 2026 Governance Disclosures with ASX
Aug 23, 2026
Lindsay Australia Limited has lodged its Appendix 4G and confirmed the availability of its corporate governance statement for the financial year ended 30 June 2026 in both its annual report and on its website. The statement, approved by the board,...
Lindsay Australia boosts revenue and profit, lifts EPS and dividend
Aug 23, 2026
Lindsay Australia reported a strong financial performance for the year ended 30 June 2026, with revenue rising 26.4% to A$1.09 billion from A$859.0 million a year earlier. Profit after tax attributable to members increased 31.5% to A$22.9 million,...
Lindsay Australia Sets Staged Release of Insider Shares From Voluntary Escrow
Aug 20, 2026
Lindsay Australia has announced that 6,227,500 shares held by Robert Miller and 5,347,500 shares held by Brent Miller will be released from voluntary escrow after the company’s FY2026 full-year results, which are expected to be lodged with t...
Lindsay Australia to Release Escrowed Shares as FY2026 Results Near
Aug 20, 2026
Lindsay Australia Limited, an integrated transport, logistics and rural supply provider to the agriculture, horticulture and food industries, operates through its Rural, Hunter and Transport divisions to deliver a full production lifecycle solutio...
Lindsay Australia Sets Date and Webcast for FY2026 Results Release
Aug 5, 2026
Lindsay Australia Limited has announced it will release its financial results for the full year ended 30 June 2026 on 24 August 2026, underscoring a key reporting date for investors and stakeholders. Chief Executive Officer Clay McDonald and Chief...
Lindsay Australia Options Lapse Simplifies Capital Structure
Jul 1, 2026
Lindsay Australia Limited has notified the market of the lapse of 2,957,568 options, identified under the ASX security code LAUAA, after conditions attached to these options were not met or became incapable of being satisfied. The cessation, effec...
Lindsay Australia Director Increases Escrowed Shareholding
Jun 1, 2026
Lindsay Australia director Robert Maxwell Miller has increased his combined direct and indirect holding in the company by 1,005,000 fully paid ordinary shares, acquired over several trades in late May 2026 at prices ranging from $0.5450 to $0.5650...
Glossary
BuyA stock rated as a "Buy" is expected to perform better than the overall market or a specific benchmark over the near-to-medium term. This rating suggests the stock is likely to deliver higher returns compared to other stocks in the same sector or market index. Note: This is not investment advice; please consult a financial advisor before making investment decisions.
HoldA stock rated as a "Hold" is expected to perform in line with the overall market or a specific benchmark. This rating indicates that the stock is neither particularly compelling nor unfavorable for investment. Note: This is not investment advice; please consult a financial advisor before making investment decisions.
SellA stock rated as a "Sell" is expected to perform worse than the overall market or a specific benchmark over the near-to-medium term. This rating suggests the stock may deliver lower returns compared to other stocks in the same sector or market index. Note: This is not investment advice; please consult a financial advisor before making investment decisions.
Disclaimer
This AI Analyst Stock Report is automatically generated by our AI systems using advanced algorithms and publicly available financial, technical, and market data. While the information provided aims to be accurate and insightful, it is intended for informational purposes only and should not be considered financial advice. Any content created by an AI (Artificial Intelligence) system may contain inaccuracies and/or contain errors. Investing in stocks carries inherent risks, and past performance is not indicative of future results. This report does not account for your personal financial circumstances, objectives, or risk tolerance. Always conduct your own research or consult with a qualified financial advisor before making investment decisions. The analysis and recommendations provided are based on historical and current data and may not fully reflect future market conditions or unexpected developments. Neither the creators of this report nor its affiliated entities guarantee the accuracy, completeness, or reliability of the information presented. Use this report at your own discretion and risk.