

Automotive Properties (APPTF) Q2 2026 Earnings Report
APPTF Q2 2026 EPS Results
- Actual EPS
- $0.20
- Consensus EPS
- ―
- Beat/Miss
- ―
- One Year Ago EPS
- $0.19
APPTF Q2 2026 Revenue Results
- Actual Revenue
- $21.61M
- Expected Revenue
- $21.28M
- Beat/Miss
- Beat by +$334.89K
- YoY Revenue Growth
- +22.78%
Earnings Announcement Details
- Quarter
- Q2 2026
- Date
- 08/13/2026
- Time
- After Close
- Conference Call
- Thursday, August 13, 2026
Automotive Properties's next earnings date is estimated for November 12, 2026, based on past reporting schedules.
Q2 2026 Earnings Call Audio
No earnings call audio is available for this earnings event.
Q2 2026 Earnings Slide Deck
Q2 2026 Earnings Call Summary
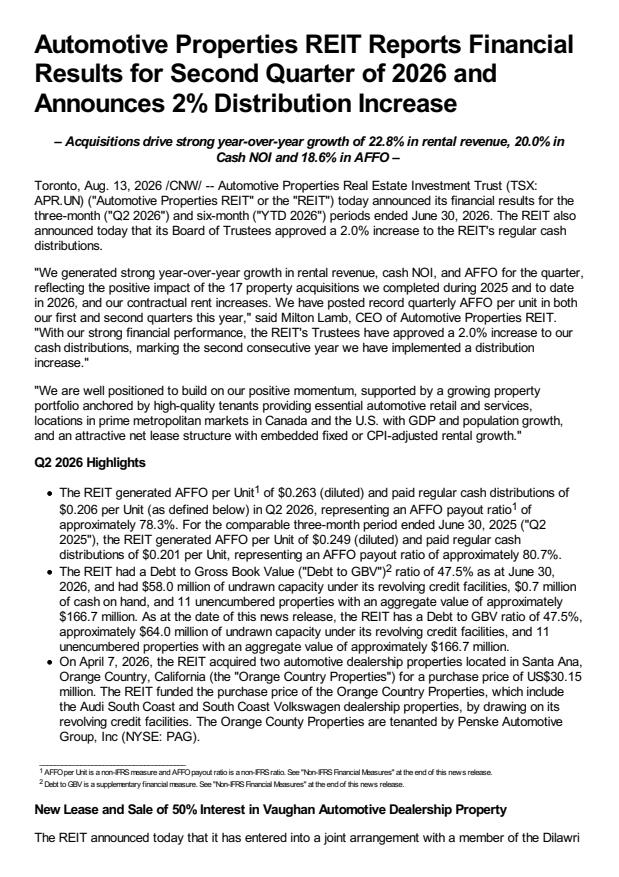
The call presented strong operational and financial momentum driven primarily by acquisitions: meaningful revenue (+22.8%), NOI (+20% total cash NOI), FFO/AFFO growth (~19%/~18%), record per-unit FFO, a distribution increase, full occupancy and a strategic Vaughan transaction that crystallized value. Offsetting items include higher interest expense from acquisition-related debt, modest same-property NOI growth (+2.2%), reliance on noncash valuation adjustments in net income, a still-elevated AFFO payout ratio (78.3%), and some refinancing timing risk given a 2.9-year weighted average debt maturity. On balance, the positives from growth, portfolio diversification (including U.S. expansion), and proactive capital management outweigh the headwinds.
Management guided that Trustees approved an ~2% annual cash distribution increase to $0.839/unit (monthly $0.0699 vs $0.0685), effective for the Sept. 15, 2026 payment (record Aug. 31); the portfolio remains 100% leased with no material lease expirations until 2028; Q2 property rental revenue rose 22.8% to $30.2M (from $24.6M), total cash NOI was $24.8M (up 20%) and same‑property cash NOI $21.1M (up 2.2%); net income & OCI were $18.1M (vs $11.2M), interest expense $8.1M (up $1.7M), G&A $1.6M (up ~$80k); FFO and AFFO increased 19.4% and 18.6% (FFO/unit $0.270 diluted vs $0.244; AFFO/unit $0.263 vs $0.249), with an AFFO payout ratio of 78.3% (vs 80.7%) and distributions paid of $0.206/unit in the quarter; portfolio cap rate 6.7% (flat), 74% of debt fixed at a weighted avg rate of 4.49%, weighted avg swap/mortgage term 3.9 years, weighted avg debt maturity 2.9 years, debt‑to‑GBV 47.5%, ~$64M undrawn capacity, 11 unencumbered properties valued at $166.7M, Facility 2 non‑revolving increased by $35M and extended to June 2030, and a 50% sale of the 69,000 sq ft Vaughan property for $16M with rent expected to commence Dec. 1, 2026.
- Strong Top-Line Rental Revenue GrowthProperty rental revenue increased 22.8% year-over-year to $30.2 million (Q2 vs. prior-year Q2), driven by acquisitions completed in 2025 and early 2026 and contractual rent escalations.
- NOI and FFO/AFFO ExpansionTotal cash NOI rose 20% to $24.8 million while same-property cash NOI increased 2.2%. FFO increased 19.4% and AFFO increased 18.6% versus prior-year Q2, reflecting acquisition contribution and embedded rent growth.
- Per-Unit Metrics and Record FFOFFO per unit (diluted) increased to $0.270 from $0.244 and AFFO per unit (diluted) rose to $0.263 from $0.249. Management called this a record quarterly FFO per unit for the REIT.
- Distribution Increase and Improved Payout RatioTrustees approved a ~2% annual cash distribution increase from $0.822 to $0.839 per unit (monthly $0.0699 vs $0.0685). AFFO payout ratio improved to 78.3% from 80.7% a year ago despite the distribution increase.
- Portfolio Leasing and Renewal ActivityPortfolio remained 100% leased with no material lease expirations until 2028. Several renewals were completed including two dealership renewals extended by an average of 7.5 years with base rent increases of ~4.8%; VW Des Source Montreal extended by 6 years (subject to CPI) and a Calgary dealership extended by 5 years.
- Value-Enhancing Vaughan TransactionEntered a 16-year triple-net lease and concurrently agreed to sell a 50% interest in the 69,000 sq ft Vaughan property for $16 million (implying ~$32 million for 100%), with rent to commence Dec 1, 2026 and closing expected in September 2026; sale described as a premium to IFRS value.
- U.S. Market Expansion and Tenant DiversificationFollowing entry into the U.S. in 2025, the REIT now owns properties in Ohio, Florida and California including tenants such as Tesla, Rivian and Penske (Audi and VW), enhancing geographic and tenant diversification.
- Balance Sheet Actions and LiquidityProactive debt management: increased non-revolving Facility 2 by $35 million and extended maturity to June 2030; 74% of debt fixed, weighted average interest rate of 4.49%, weighted average swap/mortgage term 3.9 years, weighted average debt maturity 2.9 years. At August 13, debt-to-GBV was 47.5% with ~$64 million undrawn and 11 unencumbered properties valued at $166.7 million.
APPTF Earnings History
| Report Date | Fiscal Quarter | Forecast / EPS | Last Year's EPS | EPS YoY Change | Press Release |
|---|---|---|---|---|---|
| Nov 12, 2026 | 2026 (Q3) | ―- | 0.13 | ― | ― |
| Aug 13, 2026 | 2026 (Q2) | ―0.20 | 0.19 | 5.66% (+0.01) | |
| May 13, 2026 | 2026 (Q1) | ―0.32 | 0.11 | 182.17% (+0.20) | |
| Mar 04, 2026 | 2025 (Q4) | ―0.20 | 0.18 | 13.06% (+0.02) | |
| Nov 13, 2025 | 2025 (Q3) | ―0.13 | 0.03 | 405.56% (+0.10) | |
| Aug 14, 2025 | 2025 (Q2) | ―0.19 | 0.54 | -65.13% (-0.35) | |
| May 14, 2025 | 2025 (Q1) | ―0.11 | 0.3 | -63.15% (-0.19) | |
| Mar 05, 2025 | 2024 (Q4) | ―0.18 | -0.22 | 179.03% (+0.40) | |
| Nov 14, 2024 | 2024 (Q3) | ―0.03 | 0.41 | -93.77% (-0.39) | |
| Aug 14, 2024 | 2024 (Q2) | ―0.54 | 0.3 | 78.40% (+0.24) |
The table shows recent earnings report dates and whether the forecast was beat or missed. See the change in forecast and EPS from the previous year.
