

Want to see BIIB full AI Analyst Report?
Biogen (BIIB) Price & Analysis
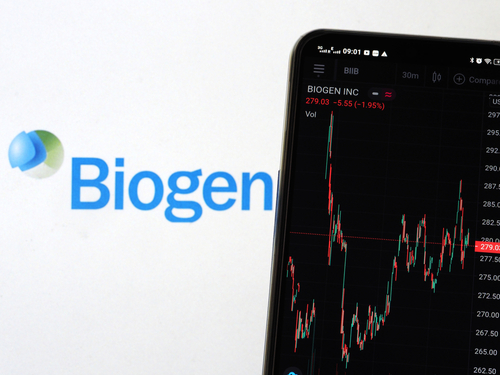
BIIB Stock Chart & Stats
- Day’s Range
- $251.19 - $258.73
- 52-Week Range
- $146.52 - $258.78
- Previous Close
- $249.65
- Volume
- 596.37K
- Average Volume (3M)
- 1.30M
- Market Cap
- $37.49B
- Enterprise Value
- $39.88B
- Total Cash (Recent Filing)
- $1.30B
- Total Debt (Recent Filing)
- $7.80B
- Price to Earnings (P/E)
- 107.5
- Beta
- 0.43
- Next Earnings
- Feb 17, 2027
- EPS Estimate
- 2.86
- Next Dividend Ex-Date
- N/A
- Dividend Yield
- N/A
Bulls Say, Bears Say
Bulls Say
Growth Portfolio Momentum
Rapid growth in the newer portfolio is reducing reliance on Biogen’s legacy MS franchise and broadening its revenue base. The portfolio’s increasing contribution supports a more durable return to growth, provided adoption remains strong across its neurological and specialty products.
Pipeline Diversification
A diversified late-stage pipeline gives Biogen several opportunities to replenish or expand its product portfolio rather than depending on one therapeutic area. Multiple registrational programs can improve long-term growth resilience if clinical and regulatory outcomes support commercialization.
Cash Generation
Substantial operating and free cash flow indicates that Biogen’s earnings remain meaningfully supported by internally generated cash. This provides capacity to fund research, launch products, pursue business development, and reduce debt while maintaining strategic flexibility.
Bears Say
Profitability Compression
The sharp decline in operating and net margins weakens earnings durability even though revenue is growing modestly. Lower profitability reduces the cash available per dollar of sales and can constrain investment capacity if higher launch and development spending persists.
VUMERITY Formulary Pressure
Formulary changes are pressuring an established product and demonstrate Biogen’s exposure to payer-driven access and reimbursement decisions. Continued pressure on VUMERITY can weigh on the legacy portfolio and require growth products to offset erosion in recurring revenue.
Acquisition-Related Debt
The post-acquisition debt burden creates a continuing call on future cash flow, even though management plans repayment by the end of 2027. Debt reduction may compete with research, launches, or additional business development if operating conditions weaken.
Biogen News










BIIB FAQ
What was Biogen’s price range in the past 12 months?
What is Biogen’s market cap?
When is Biogen’s upcoming earnings report date?
How were Biogen’s earnings last quarter?
Is Biogen overvalued?
Does Biogen pay dividends?
What is Biogen’s EPS estimate?
How many shares outstanding does Biogen have?
What happened to Biogen’s price movement after its last earnings report?
Which hedge fund is a major shareholder of Biogen?
What is the TipRanks Smart Score and how is it calculated?
Biogen Stock Smart Score
Company Description
Biogen
Biogen Inc. is a leading biotechnology firm dedicated to the discovery, development, production, and distribution of treatments for complex neurological and neurodegenerative conditions. Its established portfolio includes a range of medications addressing multiple sclerosis (MS), such as TECFIDERA, VUMERITY, AVONEX, PLEGRIDY, TYSABRI, and FAMPYRA. For spinal muscular atrophy (SMA), Biogen provides SPINRAZA, while FUMADERM is available for the treatment of plaque psoriasis. Among its other key offerings is ADUHELM, specifically developed for Alzheimer's disease. The company also markets a selection of biosimilar drugs, including BENEPALI (an etanercept biosimilar akin to ENBREL), IMRALDI (an adalimumab biosimilar comparable to HUMIRA), and FLIXABI (an infliximab biosimilar referencing REMICADE). Further extending its therapeutic reach, Biogen supplies RITUXAN, prescribed for conditions like non-Hodgkin's lymphoma, chronic lymphocytic leukemia (CLL), rheumatoid arthritis, certain types of ANCA-associated vasculitis, and pemphigus vulgaris. RITUXAN HYCELA targets non-Hodgkin's lymphoma and CLL, and GAZYVA is utilized for CLL and follicular lymphoma. OCREVUS addresses both relapsing and primary progressive forms of MS, complementing the company's broader efforts in anti-CD20 therapies. The company maintains a robust research and development pipeline, featuring numerous investigational therapies. These candidates are designed to tackle a wide spectrum of conditions, including multiple sclerosis and neuroimmunological disorders (e.g., BIIB135, BIIB061, BIIB091, BIIB107), Alzheimer's disease and other forms of dementia (e.g., Aducanumab, Lecanemab, BIIB076, BIIB080), neuromuscular disorders (e.g., BIIB067, BIIB078, BIIB105, BIIB100, BIIB110), Parkinson's disease and related movement disorders (e.g., BIIB124, BIIB094, BIIB118, BIIB101, BIIB122), neuropsychiatric conditions (e.g., BIIB125, BIIB104), immunology-related illnesses (e.g., Dapirolizumab pegol, BIIB059), acute neurological events (e.g., BIIB093, BIIB131), and neuropathic pain (e.g., BIIB074). Additionally, several biosimilar candidates, such as BYOOVIZ, BIIB800, and SB15, are progressing through various developmental stages. Biogen actively engages in strategic collaborations and licensing arrangements with various partners, including Acorda Therapeutics, Inc., Alkermes Pharma Ireland Limited, Denali Therapeutics Inc., Eisai Co., Ltd., Genentech, Inc., Neurimmune SubOne AG, Ionis Pharmaceuticals, Inc., Samsung Bioepis Co., Ltd., Sangamo Therapeutics, Inc., and Sage Therapeutics, Inc. Established in 1978, Biogen Inc. maintains its corporate headquarters in Cambridge, Massachusetts.
- Sector
- Healthcare
- Industry
- Drug Manufacturers - General
- CEO
- Christopher A. Viehbacher
- Employees
- 7,500
- Website
- www.biogen.com
- Address
- 225 Binney Street, Cambridge, MA, 02142, US
Biogen (BIIB) Earnings & Revenues
BIIB Company Deck
BIIB Earnings Call
Earnings Call SentimentPositive
The call was strongly positive overall. Biogen reported double-digit revenue growth, accelerating growth-portfolio performance, rapid Appellis synergy capture, strong adoption of key products, record early-stage pipeline productivity, solid free cash flow, debt repayment, and higher 2026 EPS guidance. The main challenges were VUMERITY's formulary-driven decline, acquisition-related charges and higher operating expenses, expected Q4 inventory and revenue normalization, SYFOVRE discontinuation levels, and uncertainty around upcoming clinical readouts.
View all BIIB earnings summariesBIIB Net sales Breakdown
- 71.98% Product revenue
- 18.81% Revenue from anti-CD20 therapeutic programs
- 1.80% Alzheimer's collaboration revenue
- 7.41% Contract manufacturing, royalty and other revenue

BIIB Stock 12 Month Forecast
Average Price Target
Technical Analysis
Overall Consensus
| Indicator | Bullish | Neutral | Bearish |
|---|---|---|---|
| Overall Consensus | 14 | 5 | 3 |
| Technical Analysis | 2 | 5 | 3 |
| Moving Averages | 12 | 0 | 0 |