


From every technical angle, casinos and resorts operator Las Vegas Sands (LVS) looks utterly enticing. Heading into the weekend, LVS stock dropped more than 4%, placing last week’s performance under a dark cloud. Since last week’s highs of ~$54, the stock has shed more than 10% of its market value, now trading closer to $45 per share.
Elevate Your Investing Strategy:
- Take advantage of TipRanks Premium at 50% off! Unlock powerful investing tools, advanced data, and expert analyst insights to help you invest with confidence.

Sure, the half-year return stands at over 54%. With LVS stock seemingly stuck in a sideways consolidation since late July, some traders are understandably getting restless. However, from a quantitative perspective, Las Vegas Sands presents a compelling opportunity.
Essentially, every publicly traded entity has a baseline personality or rhythm. So long as this sentiment regime stays stable, quantitative traders can calculate the likelihood of forward movements based on past analogs.
However, what makes LVS stock intriguing at this juncture is that it’s off its baseline personality. Instead, it has suffered volatility, thereby throwing the equity off its equilibrium. While this doesn’t sound inviting at face value, historical data shows that when the red ink flies, speculators tend to buy the dips.
As such, there is an asymmetry between what most people expect and what could actually happen based on conditional past analogs. This asymmetry is what makes specific LVS stock options strategies “favorably mispriced.”
Exposing the Hole in Black-Scholes-Based Assumptions
Before diving into the actual strategy, it’s helpful to understand how most retail traders engage the options market. This way, we can pinpoint vulnerabilities and simultaneously bring robust solutions to the table.
While hard statistics are difficult to come by, I’d say that 80% of retail options trades are debit-based transactions: people pay a premium for the right to speculate on the direction of a security. Fundamentally, the idea here is to use leverage to multiply your reward potential. Given that options expire, market participants must deploy rigorous analytics to probabilistically determine where and when a security may end up.
Here, most traders resort to the Black-Scholes-Merton (BSM) model to generate a projected range of price outcomes based on the target security’s implied volatility. However, this approach may be a category error. Simply put, the BSM is a pricing framework that attempts to estimate the fair value of a forward-looking contract. It’s not designed as a probabilistic model.
Mathematically, the flaw in BSM is that it assumes a lognormal distribution of pricing outcomes. Thus, the only difference among BSM calculations for various stocks is the IV. However, this is a ludicrous assumption because every stock is different and features unique distributional curves. There is another way, so to speak.
Deciphering the Volatility Fingerprint of LVS Stock
As mentioned earlier, every publicly traded entity features a baseline personality. If a security always traded within this baseline, the likelihood of its fluctuations can be routinely calculated from historical pricing data. However, circumstances constantly change, leading the security to respond to a variety of behavioral states.
By converting price action from a continuous scalar signal to discrete events, we can classify and categorize these distinct states, thereby facilitating probabilistic inferences related to their responses and transitions.
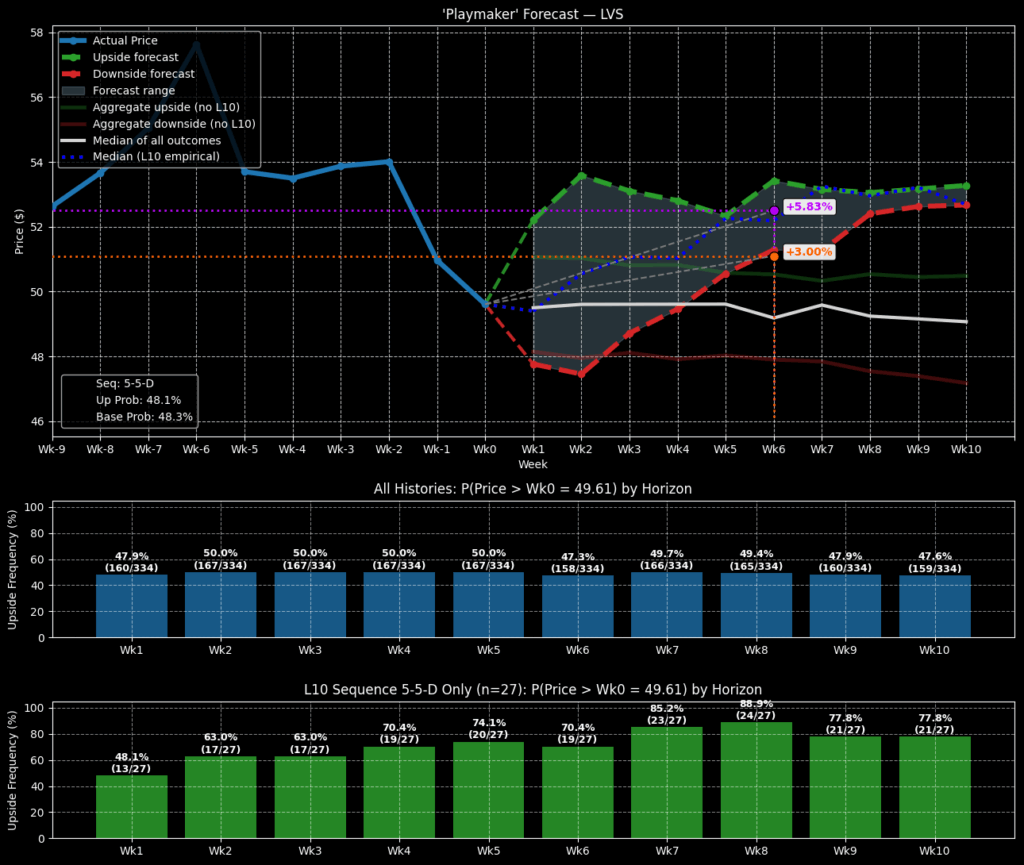
Specifically, up until Thursday of last week, LVS stock was printing a rare 6-4-D sequence: six up weeks, four down weeks, with an overall downward trajectory across the 10-week period. This sequence is significant due to its rarity, which leads to inferences that differ significantly from baseline expectations. However, due to the severity of Friday’s selloff, LVS ended up printing a 5-5-D sequence.
It’s not what I was expecting, yet the implications are still positive for contrarians: basically, when LVS stock suffers extended volatility, the perceived discount inspires buy-the-dip sentiments.
According to my proprietary Volatility Fingerprint (or VolaPrint for short) model, the probabilistic distribution of pricing outcomes over the next 10 weeks for the 5-5-D sequence sits above the baseline or aggregate pricing distribution.

To be fair, the spread of potential outcomes is much wider for the 5-5-D sequence than for the baseline distribution, which in theory means that LVS stock is much more volatile and unpredictable in the current sentiment regime. However, this spread is projected to land above the upper threshold of the baseline distribution curve.
Colloquially speaking, there is a greater likelihood of upside profitability under the current regime than under baseline conditions.
Putting Two and Two Together
Based on the available evidence, the trade that arguably makes the most sense is the 50.00/52.50 bull call spread expiring November 21st. This multi-leg transaction involves buying the $50 call and simultaneously selling the $52.50 call, for a net debit paid of $110 (the most that can be lost in the trade).

Should LVS stock rise through the second-leg strike price ($52.50) at expiration, the maximum profit stands at $140, a payout of over 127%. Breakeven comes in at $51.10, which is 3% above Friday’s closing price.
Ordinarily, the above spread would be considered quite aggressive. Using calculations derived from the BSM framework, the probability that LVS stock will reach breakeven is only about 42%. However, because the median price of outcomes tied to the 5-5-D sequence is projected to exceed $52 on expiration, the odds should be better than 50/50. If so, the 50.00/52.50 bull spread expiring on the November monthly chain would be considered “favorably mispriced.”
Is LVS a Good Stock to Buy?
Turning to Wall Street, LVS stock carries a Moderate Buy consensus rating based on nine Buys, six Holds, and zero Sell ratings over the past three months. The average LVS price target is $59.39, implying 23% upside potential over the coming 12 months.

Let Math Be the Guiding Light for LVS Investors
While Las Vegas Sands appears to be struggling for traction at the moment, historically, this underperformance tends to attract discount-oriented speculators. With the probabilistic distribution curve currently extending beyond the upper threshold of the baseline distribution, there’s a clear empirical incentive to roll the dice on LVS stock.