


TipRanks now covers nearly 7,000 ETFs. Our ETF Holdings page gives you the entire list of holdings in each ETF, along with all the basic information about the fund. We also give you a gist of the various TipRanks tools for each holding.
Pick the best stocks and maximize your portfolio:
- Discover top-rated stocks from highly ranked analysts with Analyst Top Stocks!
- Easily identify outperforming stocks and invest smarter with Top Smart Score Stocks
How to Find the ETF Holdings Page
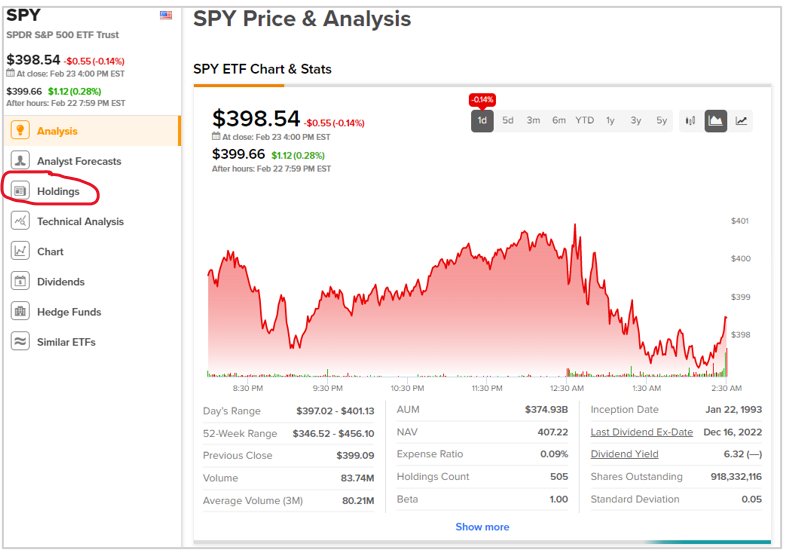
To start, search for the ETF you are researching using the search bar, by entering either the name of the fund or its ticker symbol. By default, when searching for an ETF, it will take you first to the ETF Analysis page. The Holdings page appears on the menu on the left-hand side of the screen.
# ETF Holdings Information
The ETF Holdings page gives you information about the total holdings in the ETF, total assets under management (AUM), the percentage contribution by the top 10 holdings, and the region where the ETF holdings are focused. You will also find the asset class of the ETF, meaning whether it is an equity fund, fixed income ETF, commodity ETF, currency ETF, and so on. Further, you will find the category of stock holdings, namely, small-cap, mid-cap, or large-cap.
# ETF Holdings List
Below the general ETF information, you will find the entire list of the ETF’s holdings along with each holding’s weight allocation in the fund. Moreover, you will find different TipRanks parameters for each holding, including market capitalization, daily price change, yearly gain/loss, analyst consensus, analyst price target, and TipRanks’ smart score. What’s more, you can click on each stock in the list to further research the stock.
# Sectoral, Regional, and Smart Score Breakdown
At the bottom of the page, you will find three more charts. One displays the ETF’s sector-wise breakdown, meaning sector-wise allocation of the fund’s holdings. Next, you will find the geographical breakdown, which will show you the country-wise allocation of the fund’s holdings. And finally, you will find the Smart Score breakdown, which will show you what percentage of the fund’s holdings have a Smart score rating of 10, 9, 8, and so on.
Working Example of TipRanks’ Holdings Page
Let us learn about the Holdings tool with the example of a popular ETF, the SPDR S&P 500 ETF Trust (SPY). SPY is a North America-focused, large-cap, equity-only ETF with 505 stocks in its basket. As of February 2023, SPY has total assets under management (AUM) of $374.93 billion and the top 10 stocks account for roughly 25.62% of the total fund.

You can also see Apple’s market capitalization, daily price change, yearly gain/loss, a Strong Buy analyst consensus, $171.94 price target, and a “Perfect 10” Smart Score.
Further below, you will see SPY’s sectoral allocation. SPY has the highest allocation to the Technology sector at 33.55%, followed by Consumer Goods (15.08%), and Financial (14.27%.)
Similarly, you will see that SPY is an all-U.S.-focused fund, with no other geographical allocation. Finally, you will see SPY has a Smart Score of 8, which is derived by a weighted average calculation. Of all its holdings, 15.99% of SPY’s stocks have a Smart Score of 10, 20.85% of its stocks have a Smart Score of 9, and so on.

Now, give it a try and see how the tool effectively helps you in studying the components of an ETF.