

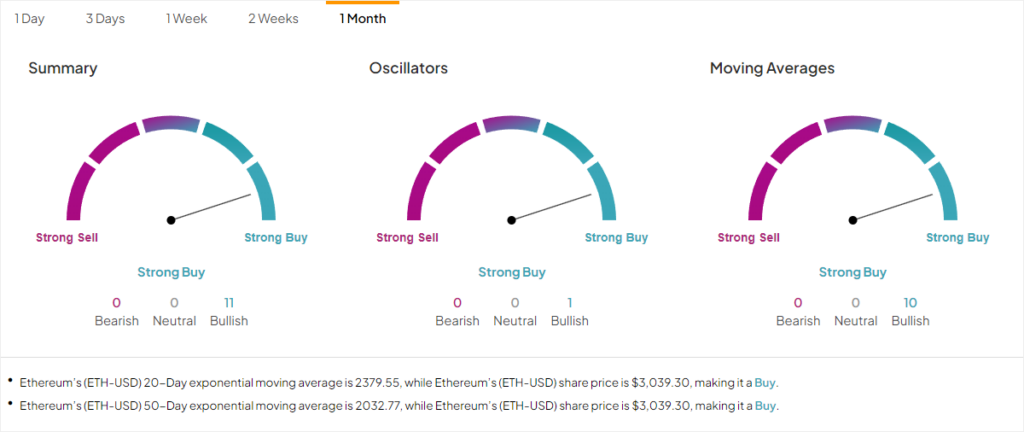
Ethereum’s (ETH-USD) technical analysis tells a mixed story for the cryptocurrency market’s second-largest coin. In today’s analysis, we’ll be using TipRanks’ Summary of all the Indicators. Let’s start with the one-month timeframe, where Ethereum’s 20-period exponential moving average (EMA) lands at $2,379.55 and the 50-period EMA at $2,032.77. Both these figures sit comfortably below the current share price of $3,051.16. By classic standards, this suggests a firm Buy. But let’s not pop the champagne just yet.
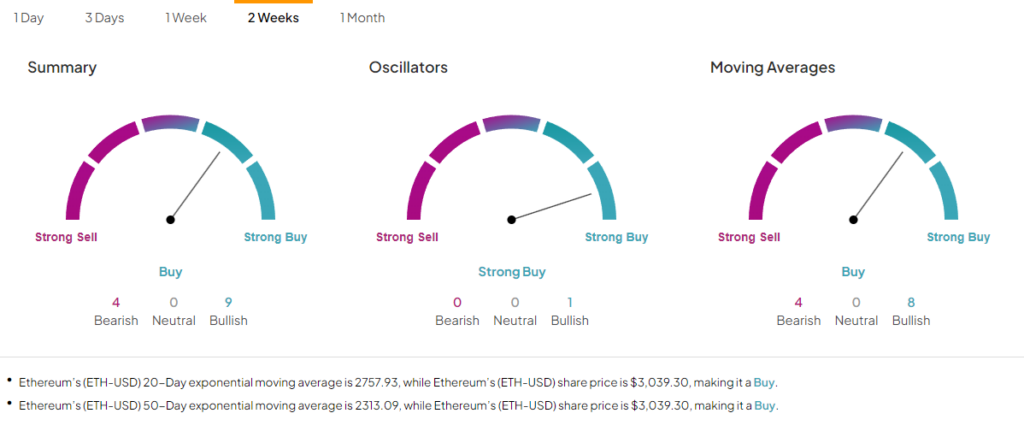
In the two-week timeframe, sentiment is packing confidence. The 20-period EMA jogs up to $2,757.93, with the 50-period EMA trekking behind at $2,313.09. Again, both are under the shadow of Ethereum’s latest price. More signs screaming Buy? Perhaps in a simpler world.
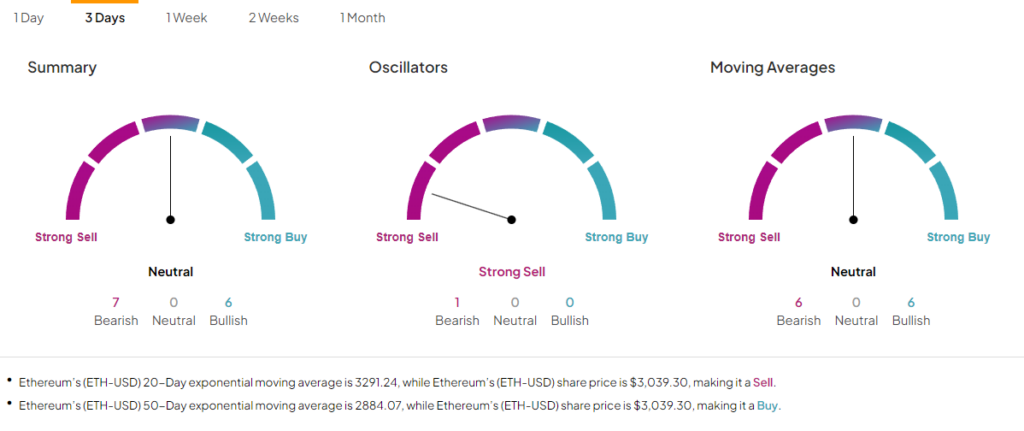
Short-Term Blur: A Bearish Growl in the Bullish Choir
Looking at the most recent week and the past three days—here’s where things get spicy. The one-week 20-period EMA is at $3,088.36, just a hair above where Ethereum is currently at, hinting at a Sell. The three-day outlook throws similar shade with the 20-period EMA well above ETH’s price at $3,291.24. What’s consistent, though, is the 50-period EMA’s comforting Buy signal throughout.

In a nutshell, longer timeframes show that things are still bullish and cozy in their trajectory above the EMAs. However, the shorter spans could be whispering caution.
Don’t let crypto give you a run for your money. Track coin prices here
