


Coca-Cola (KO) isn’t the first name that comes to mind for an appealing options trade. Its strong recent earnings report further complicates the setup—once the unknowns are priced in, opportunities to exploit inefficiencies tend to shrink. Even so, for patient traders, a potential opportunity may still be taking shape.
Elevate Your Investing Strategy:
- Take advantage of TipRanks Premium at 50% off! Unlock powerful investing tools, advanced data, and expert analyst insights to help you invest with confidence.
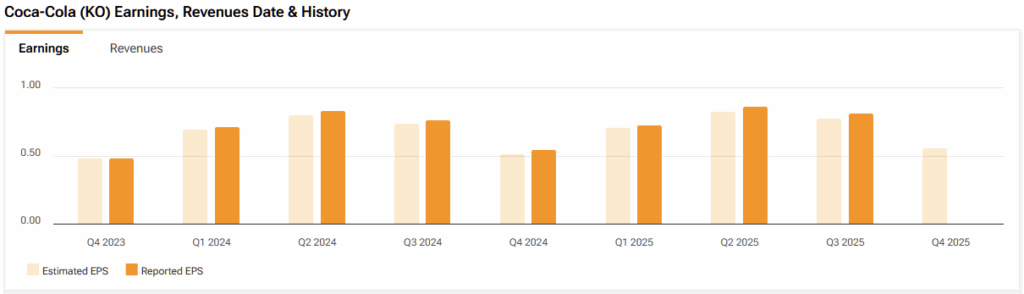
Right now, enthusiasm for KO stock is buoyant thanks to the underlying company’s third-quarter performance. In particular, Coca-Cola reported revenue of $12.46 billion, landing above Wall Street analysts’ consensus view of $12.41 billion. Also, the top-line tally represented 5% growth from the year-ago quarter. Combined with adjusted earnings per share of 82 cents — and thus beating the estimate of 78 cents — Coca-Cola stock surged above $70 yesterday.
Exposing the Flaws of Fundamental and Technical Reasoning
Before diving into the quantitative approach, let’s consider how the traditional methodologies of fundamental and technical analysis would likely view KO stock. In this manner, one can understand the flaws of the approach and the utility of quant-minded frameworks.
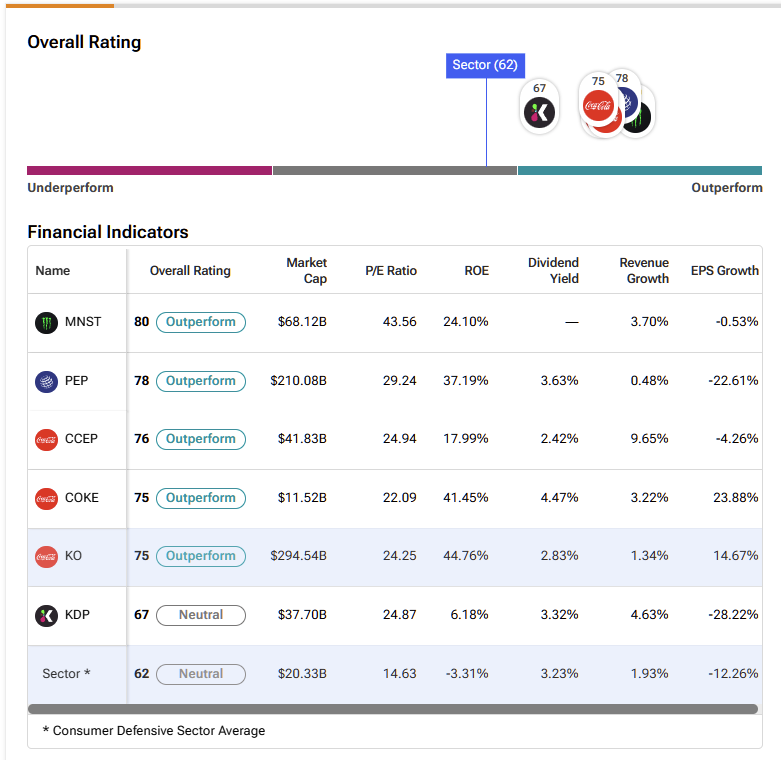
Almost surely, a fundamental analyst would point to KO stock and note that it’s trading at 23x trailing-year earnings, which is below its 28x multiple at the end of Q2. If the analyst wants to go the extra mile, the beverage sector’s multiple of 27x may be cited as evidence of undervaluation.
However, a lower number relative to another doesn’t automatically signal undervaluation—just as a “cheap” stock isn’t inherently inferior to one that appears “expensive.” These are merely labels that reveal little about the underlying factors shaping those metrics, such as earnings growth, leverage, or margin structure.
Ultimately, valuation references are meaningless without normalizing the metrics being compared, as multiples are context-dependent ratios, not universal truth claims. In that regard, technical analysis is the worst offender because not only are there no universal truth claims, but the entire premise is dependent on the author.
It’s the same flaw with the fundamental approach, to be fair. However, technical analysis goes a step further because there is no governing standard to define any of the supposed patterns that undergird the discipline.
Indeed, without a clear empirical framework to test or falsify its claims, it can sometimes be difficult to tell whether someone is engaging in technical analysis or simply overinterpreting random market patterns.
Using the Quant Mindset to Analyze KO Stock
While traditional methodologies are vulnerable to critical flaws, they do provide easy-to-digest narratives. As such, they will likely always form the basis of the financial publication industry. That said, the quantitative approach is rapidly gaining momentum because of its empiricism.
At its core, quantitative analysis is a data-driven approach that uses mathematical and statistical models to analyze measurable data for making investment decisions. Much of the framework involves observations from GARCH (Generalized Autoregressive Conditional Heteroskedasticity) studies, which suggest two findings: volatility today largely depends on yesterday’s volatility, and immediate catalysts have a greater influence on market behavior than factors from the distant past.
When it comes to market analysis, the quant juxtaposes the probabilistic distribution of a particular measurable signal relative to the baseline expectation. If there is a conspicuous variance, either in probabilistic outcome or price density (clustering) dynamics, the quant trader rushes to exploit it.
Now, what was admittedly frustrating was that at the end of last week, KO stock flashed a compelling quant signal: a 4-6-D sequence, consisting of four up weeks and six down weeks, with an overall downward trajectory. Under this setup, projected price clustering — think of this metric as the number of fired arrows landing in a tight grouping — would improve upward by about half a percent, which in my opinion is significant for a boring blue chip.
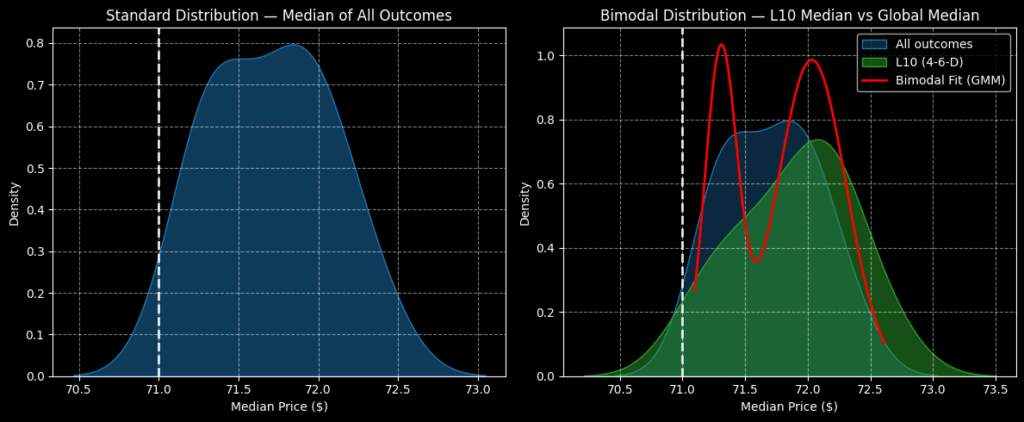
The problem, though, is that at this hour, KO stock is structured in a 5-5-U sequence. Under this setup, price clustering would actually deteriorate downward by half a percent. Obviously, that’s not what we’re looking for.
Still, the saving grace is the five consecutive down weeks that occurred between August 25 and September 26. If next week becomes a down week, quant traders would again have a 4-6-D sequence flashing, which means an exploitable positive delta in price clustering.
It’s impossible to know how the market will shake out next week. As a reference, though, if the 4-6-D sequence materializes and prices are around what they are today, you may consider the 70.00/72.50 bull call spread expiring December 19. This transaction would involve buying the lower-priced call and simultaneously selling the higher-priced call, thus creating a discounted bullish position.
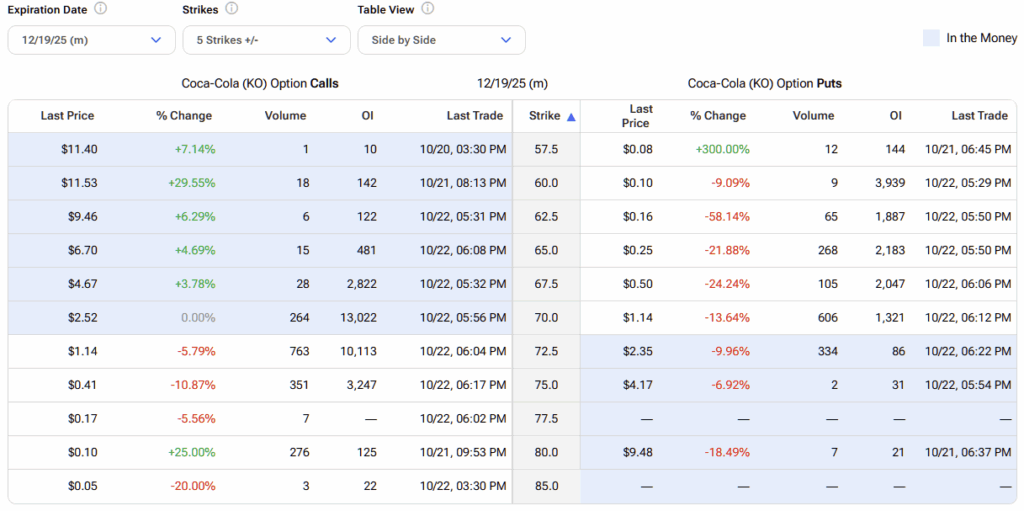
If KO stock rises through the higher strike price at expiration, you will receive a capped payout, with the magnitude depending on market conditions at the time. However, a rough expectation would be between 60% and 80%.
No, it may not be the most exciting trading opportunity—but Coca-Cola’s blue-chip status makes its pricing dynamics relatively easier to anticipate.
Is KO a Good Stock to Buy?
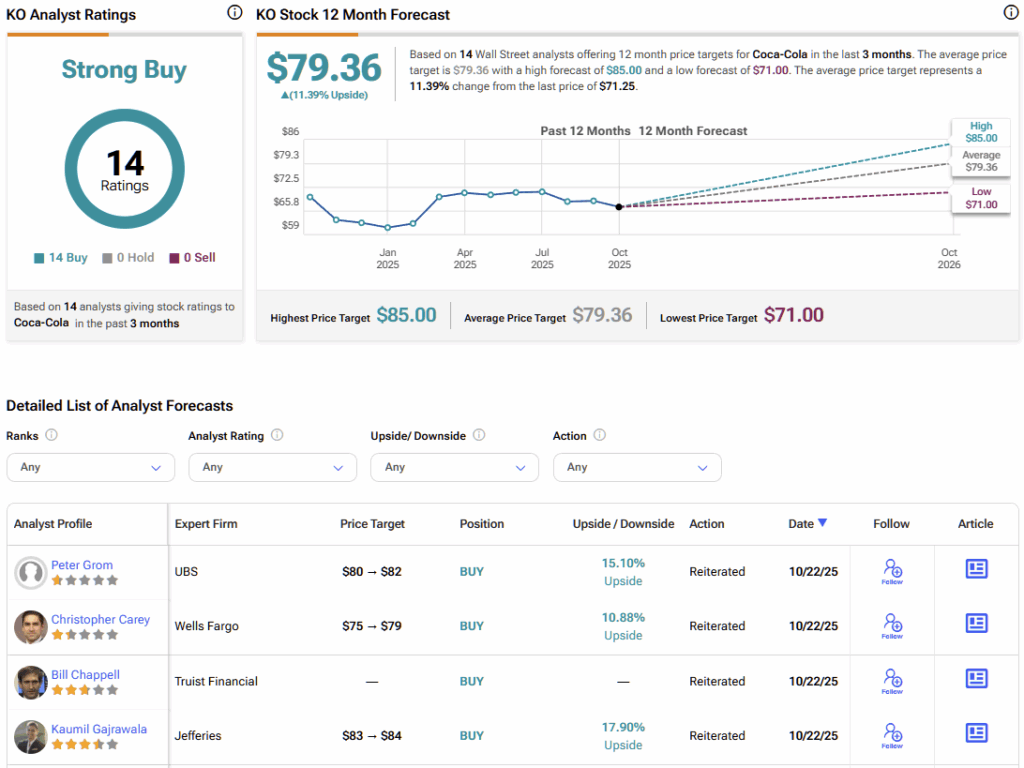
On Wall Street, Coca-Cola holds a Strong Buy consensus rating, with all 14 covering analysts maintaining bullish views. The average price target of $79.36 suggests roughly 11% upside potential over the next 12 months.
Quant Signal Could Be Brewing for Patient Traders
With Coca-Cola posting a stronger-than-expected earnings report, jumping in immediately may not be the most prudent move—regardless of what traditional fundamental or technical analysis suggests. However, KO stock could soon trigger another quantitative signal, offering a potential setup for patient, data-driven traders.