


Looking for an ETF that offers a nice mix of capital appreciation and dividends? The Pacer Developed Markets International Cash Cows 100 ETF (BATS:ICOW) is a good place to start.
While many investors are enticed by high-yield ETFs, they all too often end up being disappointed by the lackluster total returns. That’s not the case with ICOW — the ETF yields over 4%, and its three-year total annualized return of 19.2% as of the end of the most recent quarter edges out the 18.4% annualized return of the SPDR S&P 500 ETF Trust (NYSEARCA:SPY) over the same time frame.
Furthermore, this international ETF is also beating the returns of some of the largest and most popular international ETFs in the market. Let’s take a look at ICOW and what it offers investors.
What is the ICOW ETF?
You may be familiar with the popular Pacer US Cash Cows 100 ETF (NYSEARCA:COWZ), which, which we covered recently. ICOW is similar to COWZ in that it invests in companies with high free cash flow yields, but it adds an international twist to the strategy by investing in the 100 companies with the highest free cash flow yields in the FTSE Developed ex-US Index (as opposed to the domestic Russell 1000 Index that COWZ invests in).
ICOW is much smaller than COWZ, with assets under management (AUM) of $543 million, and its expense ratio is a bit higher at 0.65% compared to 0.49% for COWZ.
All About the Benjamins
This focus on free cash flow (and free cash flow yield) is the secret sauce that sets these Cash Cow ETFs apart. Free cash flow is the cash that a company has left over after it pays for things like expenses, interest, taxes, and long-term investments. This cash can then be used to create shareholder value by being used for share repurchases, dividends, acquisitions, or investing in new growth areas.
Thus, free cash flow yield, according to Pacer, is a company’s free cash flow divided by its enterprise value (market cap + debt – cash). Many experienced investors feel that focusing on free cash flow gives you a more accurate assessment of a company’s financial health rather than earnings because management teams can make many adjustments to a company’s earnings, but it’s harder to do this with cash flow.
While ICOW isn’t a dividend ETF, you can see the results of screening for high cash flow borne out in its 4.15% dividend yield. Because it is investing in companies that generate excess free cash, many of these have lots of capital to return to shareholders in the form of dividends.
Why Go International?
Investing internationally gives U.S. investors a way to diversify outside of their home market and to spread out the risk in their portfolio. It can also give them exposure to different growth opportunities. Note that ICOW invests in developed international markets, not emerging markets, so it doesn’t have the same “high-risk, high-reward” flavor that emerging market investments are known for. Holdings hail from markets like the European Union, South Korea, Japan, and Canada.
I like the idea of buying ICOW over popular larger international ETFs like the Vanguard FTSE Developed Markets ETF (NYSEARCA:VEA) and the iShares Core MSCI EAFE ETF (BATS:IEFA) because its focus on free cash flow yield has driven a higher total return over the past three years. To be clear, these blue-chip funds have given investors solid results as well, with three-year annualized returns of 13.8% and 13.2%, respectively (as of the end of the most recent quarter), but they fall short of ICOW’s 19.2% annualized return. Past performance is, of course, no guarantee of future success, but I like ICOW’s strong track in recent times.
Below, you’ll find a comparison of the performance of ICOW versus VEA and IEFA over the past few years using TipRanks’ customizable ETF Comparison Tool.

ICOW’s Holdings
ICOW has 102 positions, and thanks to the fact that it caps each investment at 2% of assets, its top 10 holdings make up just 21.8% of the fund. (This total is slightly higher than 20% because some investments outperform others and thus account for a larger percentage of the fund until its periodic rebalancing).
Below is an overview of ICOW’s top 10 holdings using TipRanks’ holdings screen. You’ll likely be familiar with a number of stocks, such as European energy giants BP (NYSE:BP) and Shell (NYSE:SHEL), as well as automakers like BMW (OTC:BMWYY), Kia (OTC:KIMTF), Honda (NYSE:HMC), and Stellantis (NYSE:STLA) (the parent company of Jeep, Dodge, Ram, and Maserati, among others).
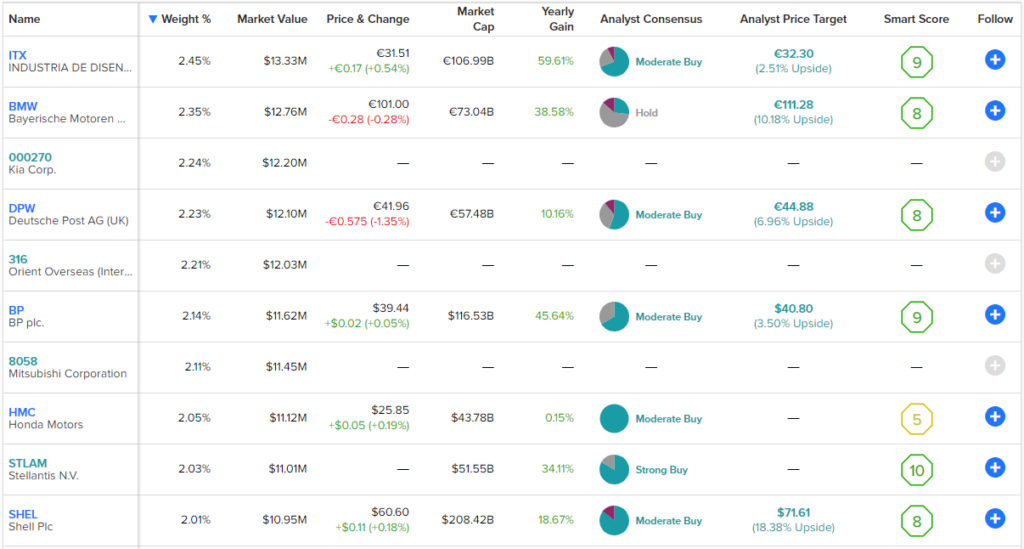
ICOW’s top holdings boast a fairly strong group of Smart Scores, with stocks like Inditex (BME:ITX), Deutsche Post AG (OTC:DPSGY), Stellantis, BP, and Shell all posting Smart Scores of 8 or better, which is equivalent to an Outperform rating. The Smart Score is TipRanks’ proprietary quantitative stock scoring system that evaluates stocks on eight different market factors. The result is data-driven and does not require any human intervention.
As you can probably surmise from looking at this list of top holdings, industrials is the top sector that ICOW invests in, with a 24.2% weighting, followed closely by energy, with a 20.7% weighting.
Investor Takeaway
Based on its strong three-year track record, which beats SPY and major international developed market ETFs like VEA and IEFA, I view ICOW as an attractive international ETF as well as a strong holding overall. ICOW does have a higher expense ratio than these low-cost ETFs, but in recent years, the results have been worth it.
ICOW’s portfolio offers investors plenty of value. Its investment universe, the 500 stocks that comprise the FTSE Developed Ex-US index, have an average P/E ratio of 12.7. While this isn’t bad by any means, the average P/E ratio of 4.6 that ICOW gets by screening for the top 100 companies in the index by free cash flow yield is even more attractive. This also compares favorably to the average price-to-earnings multiple for IEFA (13.4 as of March 31) and the S&P 500 (24).
Similarly, the index as a whole has a lackluster free cash flow yield of 4%, while ICOW boasts a much more exciting 14.7%.
I don’t even view this as a dividend ETF, but the yield of over 4% is a nice added bonus as well. While ICOW isn’t focusing on companies with high dividend yields, it turns out that screening for companies that produce lots of excess cash also nets you some nice dividends.
I like the idea of adding ICOW to a portfolio with COWZ to add international exposure while harnessing the power of this effective strategy.