

In a comparison to see if an ETF with a 13% dividend yield or one with a 2.4% dividend yield would be a better choice for dividend investors, it would seemingly be obvious that the ETF with the 13% yield would be the superior option. However, here’s why that’s not necessarily the case. Let’s take a look at the Global X SuperDividend ETF (NYSEARCA:SDIV) and the iShares Core Dividend Growth ETF (NYSEARCA:DGRO) to find out why the answer isn’t as clear-cut as it may seem once you go beyond the surface level.
What are SDIV and DGRO?
SDIV is the “super dividend ETF” from Global X. This ETF has about $784 million in assets under management (AUM) and, as mentioned above, yields a massive 13%. It does this by investing in an index composed of 100 of the highest-yielding equities in the world. Notably, SDIV pays out dividends on a monthly basis, as opposed to the quarterly basis that most stocks and ETFs pay on.
Meanwhile, DGRO is a dividend growth ETF from BlackRock’s (NYSE:BLK) iShares that yields a far lower 2.4% and also pays a dividend on a monthly basis. It invests in U.S. stocks with growing dividends, and it is much larger than SDIV, with $24 billion in assets under management.
So far, things are looking good for SDIV in this comparison, but let’s look further.
Comparing Their Holdings
DGRO holds 430 positions, and its top 10 holdings make up just 25.9% of the fund, so this ETF offers investors plenty of diversification. Below, you’ll find an overview of DGRO’s top 10 holdings using TipRanks’ holdings tool.
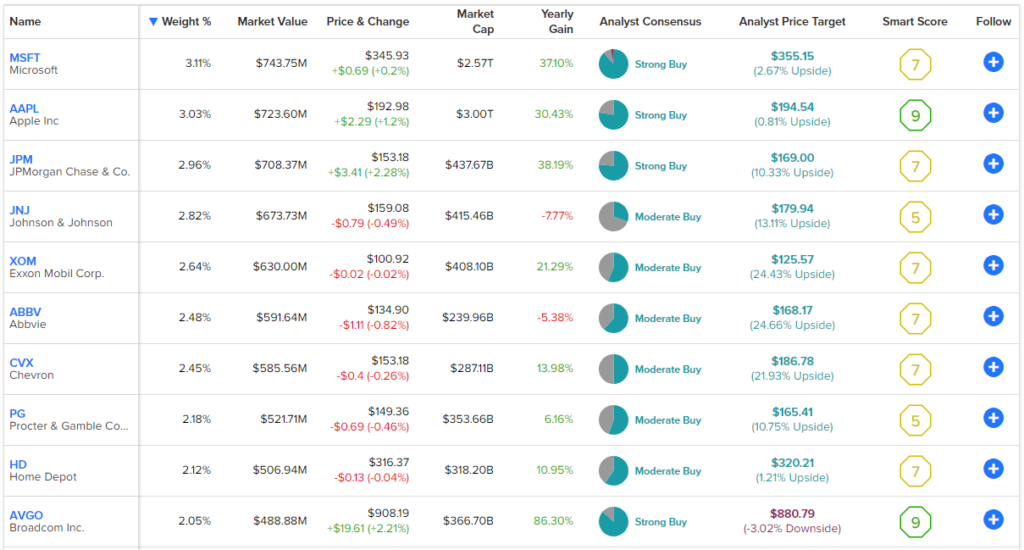
As you can see, this is a strong group of holdings, and most investors would generally agree that these are blue-chip stocks, whether they are mega-cap tech leaders like Microsoft (NASDAQ:MSFT), Apple (NASDAQ:AAPL), and Broadcom (NASDAQ:AVGO), international energy giants like ExxonMobil (NYSE:XOM) and Chevron (NYSE:CVX), or other well-respected stocks like JPMorgan Chase (NYSE:JPM).
Meanwhile, SDIV holds 100 positions, and its top 10 holdings account for just 13.4% of the fund, so this is a pretty diversified ETF with low concentration risk. Below, you’ll find an overview of SDIV’s top 10 holdings using TipRanks’ holdings tool.
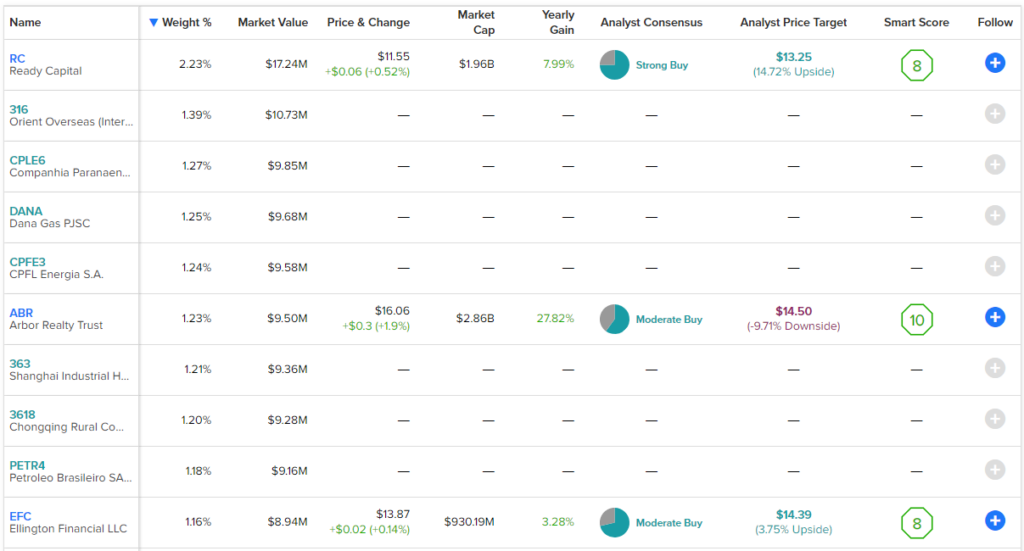
As you can see, its holdings look quite a bit different from those of DGRO. Most investors would be hard-pressed to find names that they recognize here, let alone names that are widely seen as blue-chip holdings.
In fairness to SDIV, it looks like DGRO is the clear-cut winner in this category, but it’s possible that some of these holdings are diamonds in the rough, so let’s give DRGO the edge for the better portfolio but move on to the next category, performance track record, to get a clearer picture of which is the superior ETF.
Comparing Their Performances
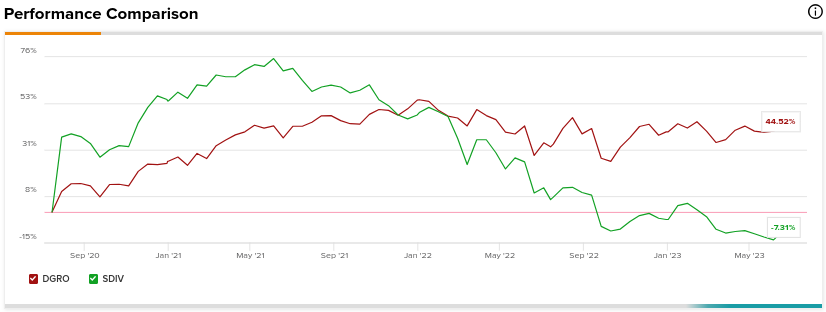
Here’s where the rubber really meets the road in this comparison. When looking at the performance of both ETFs over time, a real difference begins to emerge.
Looking at total return, which combines returns from price appreciation with dividends being reinvested, DGRO has been a pretty solid performer in recent years. As of the end of the quarter that ended in June, DGRO had a one-year total return of 11%. Going out to three years, it has posted an impressive annualized return of 13.6%.
Over the past five years, DGRO has had an annualized total return of 11.1%. Finally, going back to its inception in 2014, DGRO’s total annualized return is 10.9%. As you can see, when combining returns from dividends and price appreciation, DGRO has consistently given its investors double-digit returns for a long time.
Now let’s take a look at SDIV’s track record compared to DGRO over the same time period. As of the end of the June quarter, SDIV’s total return over the past year was -8.1%. This means that even with its large dividend yield, investors have still lost 8.1% on their investments. Zooming out to three years, the results look a little better, with a three-year annualized total return of -2.7%. However, this means that investors still lost money and lagged the performance of DGRO by a significant margin.
Over the past five years, SDIV has had an unsightly annualized total return of -10.4%. Even over a 10-year time frame, SDIV produced an annualized return of -2.3%, and since its inception in 2011, it has lost money with a total annualized return of -1.9%.
Disparity in Fees
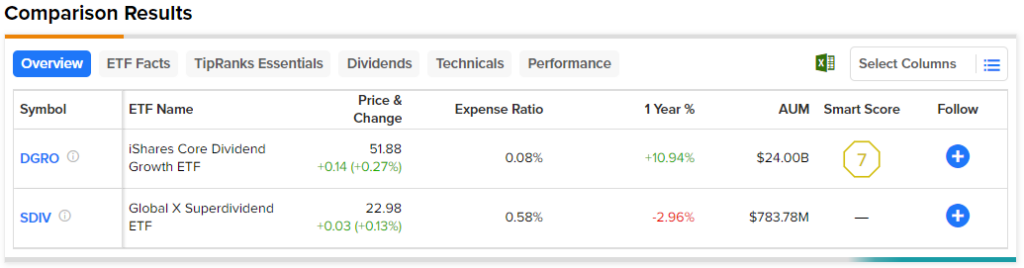
Despite losing money over each of these time frames and significantly underperforming both DGRO and the broader market, SDIV actually charges fees that are significantly higher than those of DGRO. SDIV has an expense ratio of 0.58% versus just 0.08% for DGRO.
This means that an investor allocating $10,000 to SDIV would pay $58 in fees in the first year, while an investor putting $10,000 into DGRO would pay just $8. Fees add up over time, so the difference is even greater over a longer time horizon.
For example, over the course of a decade, assuming a 5% return per year and that fees remain the same, the DGRO investor would pay $103 in fees, while the SDIV investor would pay a much higher $759. This large difference in expenses hardly seems justified, given SDIV’s underperformance.
Below, you can view a comparison of DGRO and SDIV using TipRanks’ ETF comparison tool, which allows investors to compare up to 20 ETFs at once based on a wide variety of customizable factors.
The Winner Is…
So, while DGRO investors made double-digit returns on a consistent basis, SDIV investors have actually lost money over the long run, even when its massive double-digit dividend yield is taken into account. This is why investors should look beyond just the attention-grabbing dividend yield and look at an ETF’s performance over time and why a dividend ETF with a 2.4% dividend yield like DGRO can be superior to a dividend ETF with a 13% dividend yield like SDIV.
In this comparison between two dividend ETFs with very different approaches, I believe DGRO is the winner as the better choice for dividend investors (and all investors, for that matter).
