
After the unexpected highs of the previous year, the stock market faces a turbulent period, one rife with uncertainty. Amidst heightened anxiety and a complex mix of economic and geopolitical factors, this year presents a challenging landscape for discerning investors. Against a backdrop of conflicting economic data and large discrepancies in stock market outlooks, investors are advised to pick companies that can withstand any downturn as well as capitalize on any upturn.
How to do that? Well, paraphrasing the old saying “Give a man a fish, and you feed him for a day; teach a man to fish, and you feed him for a lifetime,” in this article, I’m pleased to present you with all the fishing equipment and accessories, while showing how to efficiently use these tools to your benefit. Read on to learn how to find these companies and choose long-term winners by utilizing vast data and convenient tools provided by TipRanks.
Optimism After a Stumble
Stock markets started 2024 on the wrong foot, missing a traditional ride on Santa’s sleigh. While this rough start does not contain too much significance for the rest of the year, it certainly increases investor nervousness, which was high to begin with. After last year’s against-all-odds, blistering rally, nothing should be taken for granted. On the other hand, while potential shocks are abundant (elections, geopolitics, economic downturns, etc.), hopes are also high, if not as high as in the final days of 2023.
Viewed in this context, the start-of-the-year decline serves as a healthy correction after a stock-market surge at the end of 2023, which was led by hopes for soon-to-come Federal Reserve’s interest rate cuts. The economic reports that arrived in the last few weeks contained mixed signals, with some data points coming in stronger than expected, though others pointed to a weakening economy.
Investors’ attention continues to be drawn to upcoming data, which they hope will confirm their bets on the imminent monetary easing, as well as provide an answer to the question of whether the economy is pointing towards a “soft landing” (slower inflation and growth, but no recession).
The question about the economy’s health is crucial not only for establishing a forecast for the Fed’s policy – and, subsequently, the cost of financing, and a myriad of other factors affecting firms and individuals – but also for trying to forecast companies’ financial results at the end of the ongoing quarter, as well as building a longer-term outlook on stocks.
Investing Beyond 2023’s Themes
As opposed to the beginning of 2023, when almost everyone was pessimistic about the economy and the markets (and which was proven very wrong by the messy reality), this time there is no such harmony in opinion, with analysts from major Wall Street firms producing contrasting outlooks. This disagreement is far healthier than the previous unanimity, especially given the many expected and unexpected twists we’ll likely encounter this year. However, investors are left guessing which pundits to trust, and where to put their money this year.
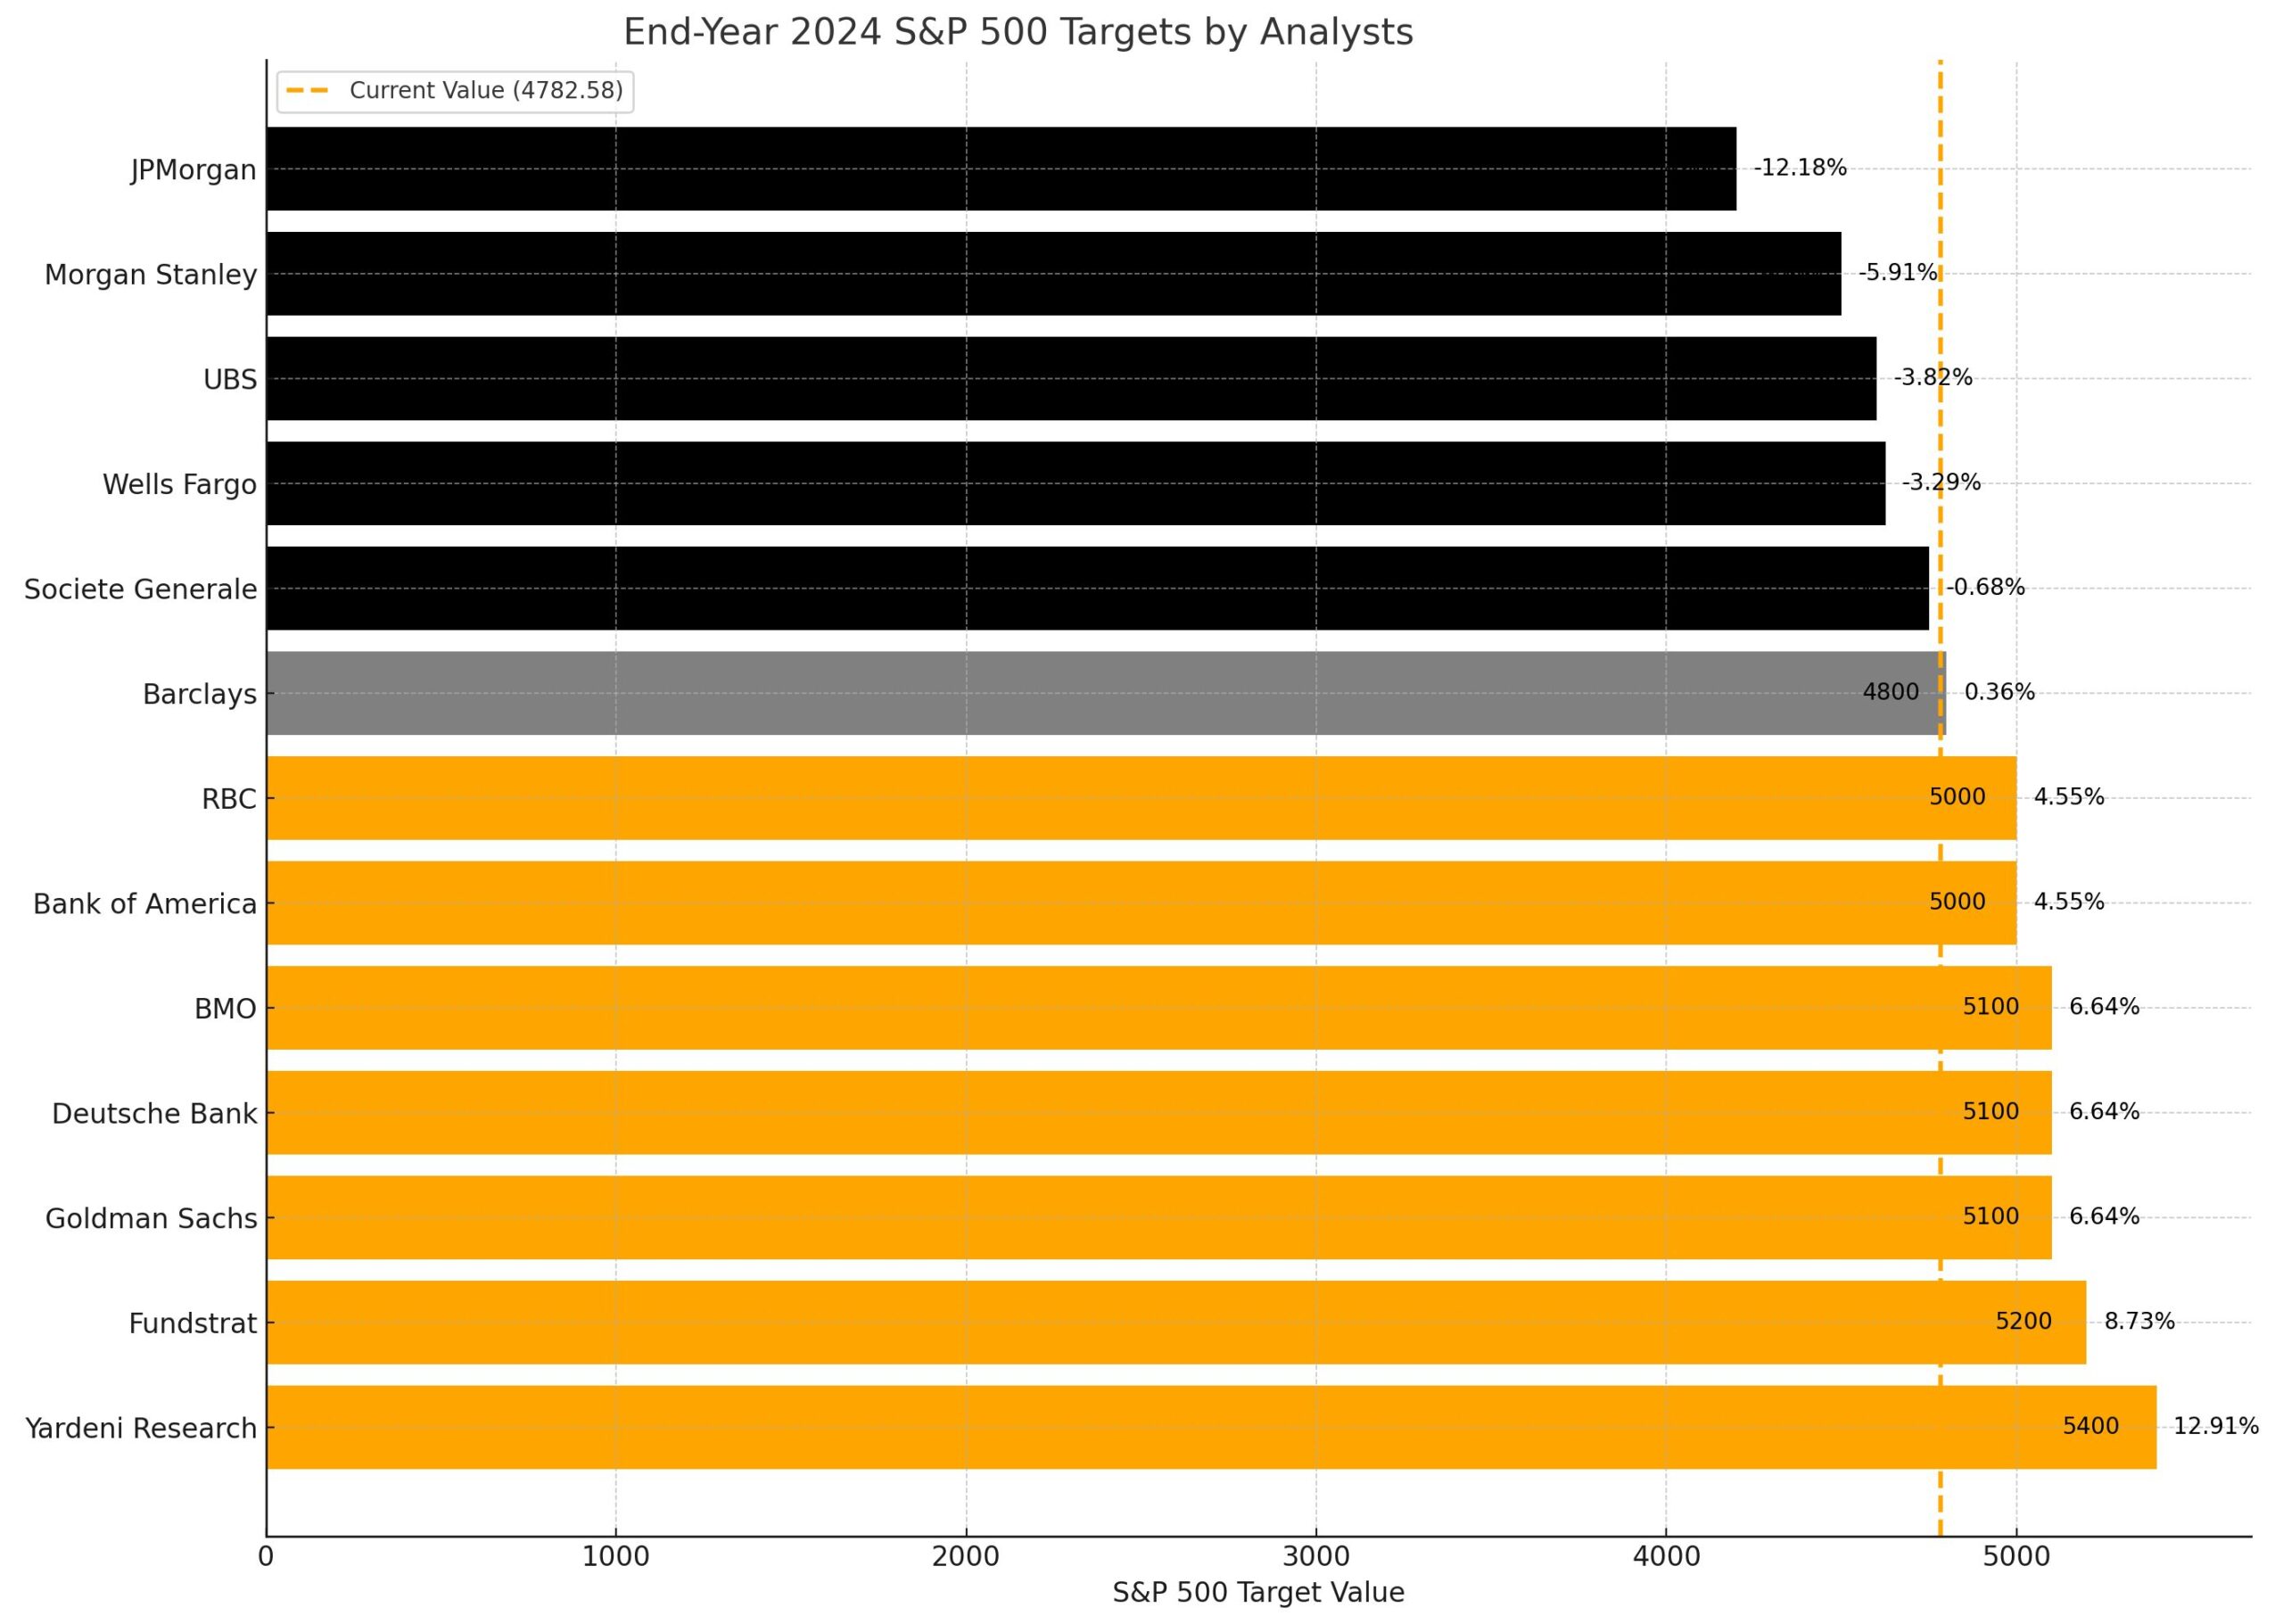
Data as of January 11, 2024
As can be seen, even the biggest bulls don’t expect the stocks to rally at the same fast pace this year, penciling in rather modest gains compared to last year. However, within the broad scope of the stock markets, some themes that propelled the rally are expected to remain intact.
For instance, the artificial intelligence (AI) theme is expected to continue drawing investor interest and inflows, benefiting technology megacaps like Microsoft (MSFT) and Nvidia (NVDA), as well as several other AI facilitators and adaptors. Incidentally (or not), these megacaps were another investment theme of last year’s rally. This year, the outlook for these giants, with the exception of Apple (AAPL) and perhaps Tesla (TSLA), continues to be positive.
However, with the economic outlook brightening but still foggy, and with the additional dose of uncertainty provided by upcoming elections and various external geopolitical events, it is arguably more difficult than ever to establish a strong conviction for stocks outside of these winning, but already saturated investment themes. Thus, I believe it’s best not to try and chase the market jolts and bounces, but rather put your stakes on several high-quality stocks that will likely perform well in any scenario.
Quality is in the Data
What are these “high-quality stocks” and how can investors find them?
First of all, to be eligible for the “quality badge”, a company must display a healthy balance sheet with reasonable debt levels and ample means to cover repayments and interest, which leave the management with enough capital to invest in the business. Second, while even a giant like Apple can encounter soft patches along the way, a long-term earnings growth trend is a prerequisite for a company to enter the quality league. Past earnings growth records should be accompanied by a comprehensible growth outlook for the next several quarters, backed by visible practical catalysts of such growth, as well as by predictability of cash flows. There is also the pricing power factor, as companies with such power protecting their margins can better withstand prolonged periods of higher financing costs or economic weakness.
While these attributes can be found within companies of all shapes and sizes, it is easier to find these quality gems among those leaning toward larger capitalizations. In addition, larger firms tend to score higher on another yardstick: the “economic moat”. One of Warren Buffett’s favorite metrics, economic moat refers to the extent to which a company can protect its market share and maintain competitive advantage over its peers. A wide economic moat helps companies in terms of the quality factors mentioned above, as lesser competition strengthens pricing power, thus supporting earnings growth.
Last but not least, investors should pay attention to the price-to-earnings ratios and other valuation multiples in comparison to peer groups, since overpriced stocks tend to have limited upsides, even if the underlying business is healthy and growing.
On the surface, distinguishing quality companies from other options looks like a lot of hard work. Well, it would be if you had to start from scratch. Thankfully, there is no need to read all prospective investees’ balance sheets and quarterly reports, since all the necessary data has been collected, analyzed, and displayed by TipRanks, along with company news and insights, as well as research and analysis produced by Wall Street’s leading analysts.
TipRanks-Powered Research: an Example
Of course, there is nothing better than a simple example to explain a stock research process. Let me show you how to arrive at an investment decision using TipRanks’ tools and database.
A small remark: in this example, I’m filtering for high-quality Financial Sector stocks. That is because financial firms were under pressure in 2023, resulting in very low valuations, while the economic and market outlook supports the view that the sector is rife with opportunities for stock pickers.
If you do not have a list of stocks prepared for analysis, the first step would be to organize one. The easiest way to do this is to start with the Top Smart Score Stocks tool, which displays the best stocks according to the TipRanks Smart Score. This unique score measures stocks on their potential to outperform the market, based on eight key factors, including the best-performing analysts’ rating, hedge funds’ buy or sell signals, as well as fundamental and technical factors.
Within the Top Smart Score tool, there is an option to filter stocks by market cap and sector to which the stocks belong. I’ve filtered for mega- and large-cap stocks that belong to the Financial Sector and received a list of 15 entities. In this customizable table, I added “Analyst Consensus” and “Analyst Price Target” fields to filter for future performance:
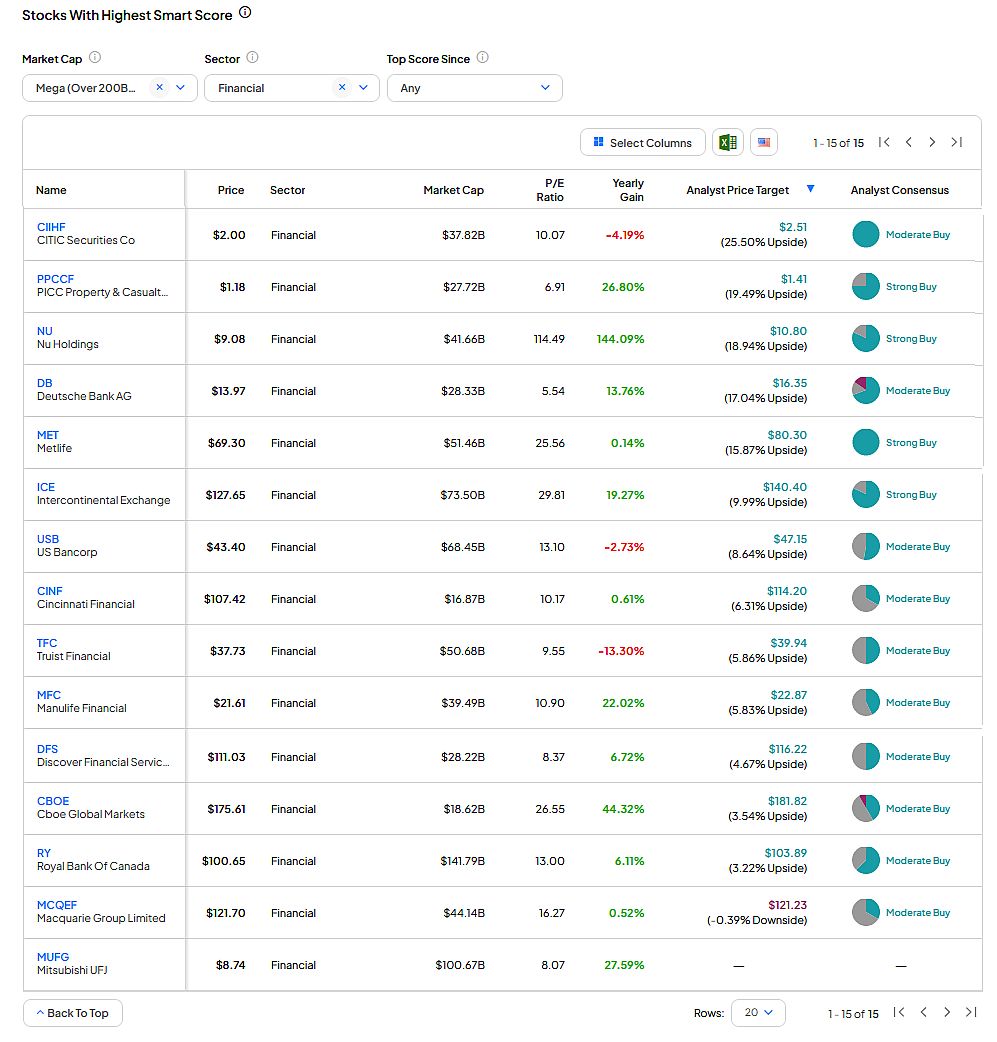
After that, I’ve filtered out two China-based companies whose future is unpredictable regardless of their financial or business metrics because of the uncertainty surrounding their government policies. I also deleted a Brazil-based digital banking platform to avoid the analysis of emerging-market economies it serves. In addition, I removed the stocks whose average analyst price targets reflect little or no upside in the next 12 months.
The resulting list of 10 stocks was placed into the tool, which is a customizable comparison table where you can slice and dice the data according to your preferences. In the “Overview” section, which can give you a basic comparison, I chose to compare these stocks’ analysts’ signals, as well as their performance over the last 12 months and the past three years (which is more indicative as it includes a down year, 2022), and their P/E ratios. In addition, there are “Dividends,” “Earnings,” and other tabs where you can drill down into the data to help you choose the right stock for you.

As can be seen, Deutsche Bank AG (DB) displays the highest forecasted average upside potential. It also carries the lowest valuation, even after its stellar stock performance over the past five years, and even more remarkable, in the past year. The insurance giant Metlife (MET) places second in terms of upside; however, it is quite pricey compared to its peers (obviously, better stock performance expectations lead to higher prices). Third place is occupied by Intercontinental Exchange (ICE), which operates regulated exchanges including NYSE, as well as clearing houses for financial and commodity markets, and provides market data, clearing services, and other capital markets services. It looks very expensive at first glance; however, the only comparable stock, Cboe Global Markets (CBOE), carries a similar price tag, while promising a much lower return.
A little side note: when looking at valuations, keep in mind that investors are prepared to pay more for size, economic moat, dividends, and growth outlook, and that different industries within a sector can have different price-to-earnings averages due to the different nature of their respective companies. In addition, this metric should be handled with care, since the “price” part of the equation can be influenced not only by hard facts, but also by rumors, perceptions, and other outside events.
The next step is the “Earnings” tab in the Comparison tool, where you can find all the metrics with regards to the companies’ fundamentals, including the one that’s crucial for shareholders: earnings per share (EPS), the reported and the forecasted data. Do not fret if you see that the next quarter’s forecasted EPS is lower than that of last year’s: it is already priced in and discounted. Rather, have a look inside each company’s “Earnings” tab (such as this one, for example) and ask yourself: Does the company tend to outpace analysts’ estimates? Does it outgrow earnings-per-share over time? If the answer to both is “yes”, you are in the clear.
Since we are analyzing financial companies’ stocks, I would advise checking the “Dividends” tab next. The Financial sector mostly includes stable, low-growth organizations, which tend to compensate their shareholders with high cash payouts. The average dividend yield for the Financial sector is currently about 2.1%; this data can be found in the “Dividends” tab of each stock’s individual TipRanks page. If you are unsure how to translate a company’s yield into hard cash in your bank account, feel free to use the Dividend Calculator.
In addition, the Stock Comparison tool lets you check and compare each stock’s long and short-term performance history, technical indicators including Momentum and SMA, the opinions of Wall Street’s leading analysts, and more.
At the end of our voyage to the best quality stocks, my advice is to open each of the three chart leaders’ individual TipRanks pages and read the constantly updated news and insights about these companies. More often than not, it takes time to incorporate new information into the datasets, while important bearish or bullish news, coupled with the existing data, can provide instant Sell or Buy signals. In addition, the stock pages let you gain insights into whether the company management is buying or selling their personal shares (very important as this can shine a light on their views about the company’s prospects), as well as hedge funds and individual investors’ change in holdings of the stock.
The Takeaway
The success of an investment hinges on knowledge. Information is power; analysis of the information is a superpower.
Thankfully, the times when the data belonged to the chosen few, while its analysis depended on an ability to hire professionals, are long gone. Now, individual investors can leverage data and research previously available only to large institutions or very wealthy individuals. TipRanks’ database and research can help anyone become a successful investor.
