


According to Morningstar Direct and Investors Business Daily, the ARK Innovation ETF (NYSEARCA:ARKK) and the Fidelity Blue Chip Growth ETF (BATS:FBCG) are the two best-performing diversified ETFs of 2023. In this case, diversified means they are not focused on a singular theme such as a country-specific ETF or a specific commodity or sector, for example.
Elevate Your Investing Strategy:
- Take advantage of TipRanks Premium at 50% off! Unlock powerful investing tools, advanced data, and expert analyst insights to help you invest with confidence.
Interestingly, both ETFs are actively managed, perhaps lending some credence to the idea that we are in a “stock picker’s market” again.
ARKK is up 67.7% year-to-date, while FBCG is up 57.3%. Both have handily outperformed the broader market. The S&P 500 (SPX) is up 23.4% year-to-date, while the Nasdaq (NDX) is up 42.6%. Which of 2023’s big winners is better for investors, going forward? Let’s compare these two hot funds.
What is the ARKK ETF’s Strategy?
Launched in 2014, ARKK is ARK Invest’s flagship fund, with $9.2 billion in assets under management. ARKK invests in companies that are driving “disruptive innovation.” ARKK describes disruptive innovation as “the introduction of a technologically enabled new product or service that potentially changes the way the world works.” ARK says that these investments can include anything from companies involved in DNA technologies and “the genomic revolution” to artificial intelligence, automation, and robotics.
Like many of ARK Invest’s ETFs, including its fintech ETF, the ARK Fintech Innovation ETF (NYSEARCA:ARKF), and its Internet ETF, the ARK Next Generation Internet ETF (NYSEARCA:ARKW), ARKK has recovered from a difficult 2022 with a massive comeback in 2023 as technology stocks soar.
What is the FBCG ETF’s Strategy?
Investment giant Fidelity describes FBCG as “a diversified domestic equity growth strategy with a large-cap bias.”
The fund’s managers state, “Our investment approach focuses on companies we believe have above-average earnings growth potential with sustainable business models, for which the market has mispriced the rate and/or durability of growth.”
Furthermore, FBCG’s portfolio managers “look for events that might provide a business catalyst — such as product cycles, a change in management, and turnaround cycles — that could add to a stock’s true value.”
FBCG is much smaller than ARKK, with $964.6 million in assets under management. FBCG is also newer than ARKK, having launched in 2020.
Portfolio Comparison
Now that we understand the investment processes for these two actively-managed ETFs, let’s look at their respective portfolios.
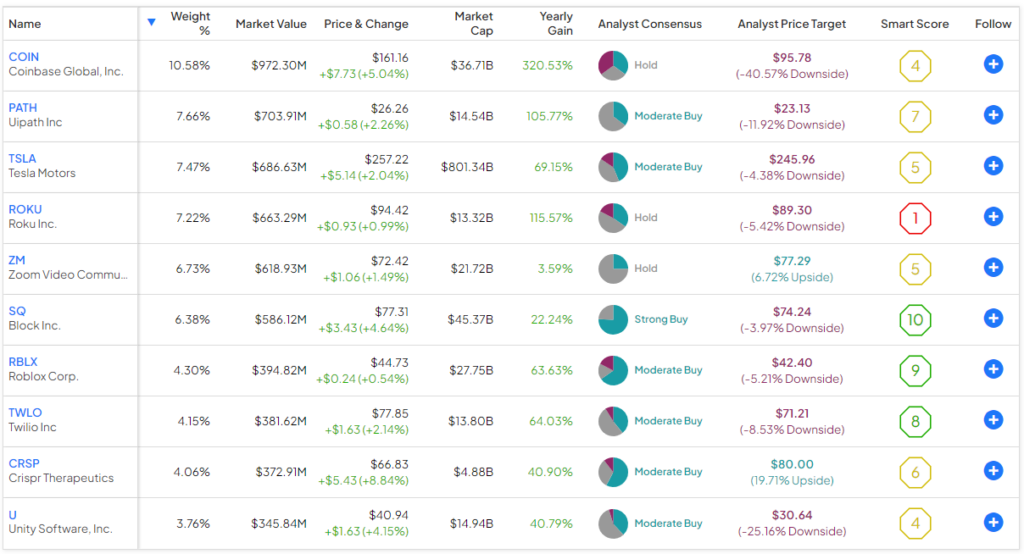
ARKK owns 34 stocks; its top 10 holdings comprise 62.31% of the fund’s assets. Below is an overview of ARKK’s top 10 holdings using TipRanks’ holdings tool.
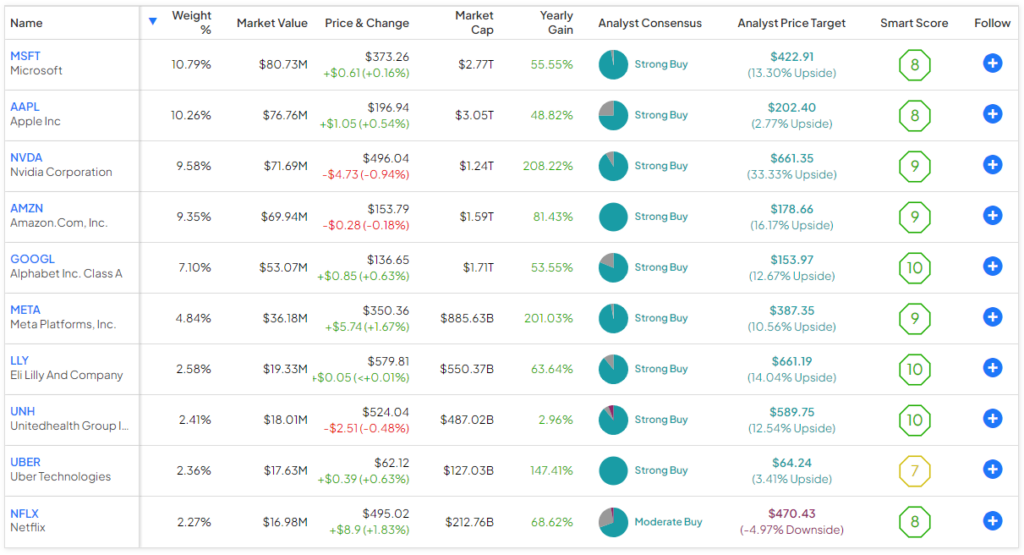
Meanwhile, FBCG owns 155 stocks, and its top 10 holdings comprise 61.5% of the fund.
Below is an overview of FBCG’s top 10 holdings using TipRanks’ holdings tool.
Interestingly, while these two actively-managed ETFs have been this year’s big winners, they do not share any top holdings.
ARKK generally skews more heavily towards more divisive, “disruptive” growth stocks like Coinbase Global (NASDAQ:COIN), Tesla (NASDAQ:TSLA), and UiPath (NYSE:PATH) (which have performed quite well this year).
Conversely, FBCG is more focused on the “blue chip” mega-cap growth stocks that more traditional tech and growth investors favor, such as Microsoft (NASDAQ:MSFT), Apple (NASDAQ:AAPL), and Nvidia (NASDAQ:NVDA). In this way, both of these ETFs live up to their names.
Interestingly, TipRanks’ Smart Score system seems to have a more favorable view of FBCG’s portfolio than ARKK’s portfolio. The Smart Score is a proprietary quantitative stock scoring system created by TipRanks. It gives stocks a score from 1 to 10 based on eight market key factors. A score of 8 or above is equivalent to an Outperform rating.
The score is data-driven and does not involve any human intervention. It gives an impressive nine of FBCG’s top 10 holdings Outperform-equivalent Smart Scores, but just three of ARKK’s top 10 holdings earn this distinction, giving a clear edge to FBCG in this area.
The Smart Score also gives FBCG an Outperform-equivalent ETF Smart Score of 8 while assigning ARKK a Neutral-equivalent ETF Smart Score of 6.
Comparison of Fees
These are both relatively expensive funds, but they are actively managed, and with their market-topping performance this year, their holders likely aren’t complaining.
Still, FBCG is a bit cheaper than ARKK, with an expense ratio of 0.59% versus ARKK’s expense ratio of 0.75%. This means that an investor putting $10,000 into ARKK will pay $75 in fees over the course of one year, while an investor putting the same amount into FBCG will pay $59.
This may not sound like much of a difference, but the fee disparity can make a big difference over time. Assuming each ETF returns 5% per year going forward and maintains its current expense ratio, the FBCG investor would pay $738 in total fees, while the ARKK investor would pay $931.
Is ARKK Stock a Buy, According to Analysts?
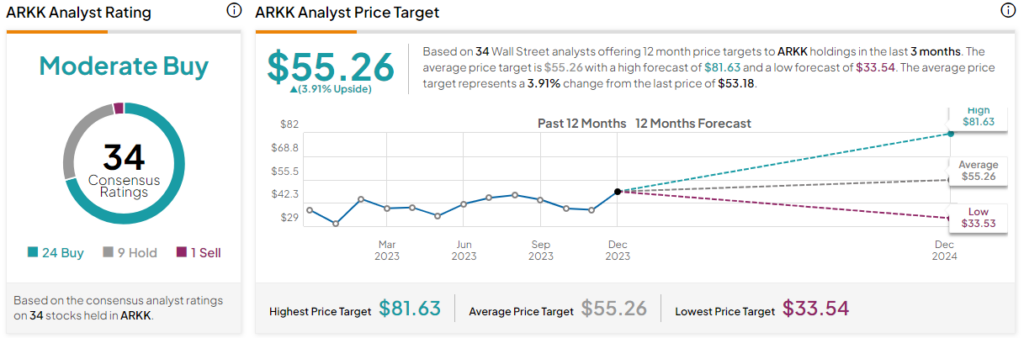
Turning to Wall Street, ARKK earns a Moderate Buy consensus rating based on 24 Buys, nine Holds, and zero Sell ratings assigned in the past three months. The average ARKK stock price target of $55.26 implies 3.9% upside potential.
Is FBCG Stock a Buy, According to Analysts?
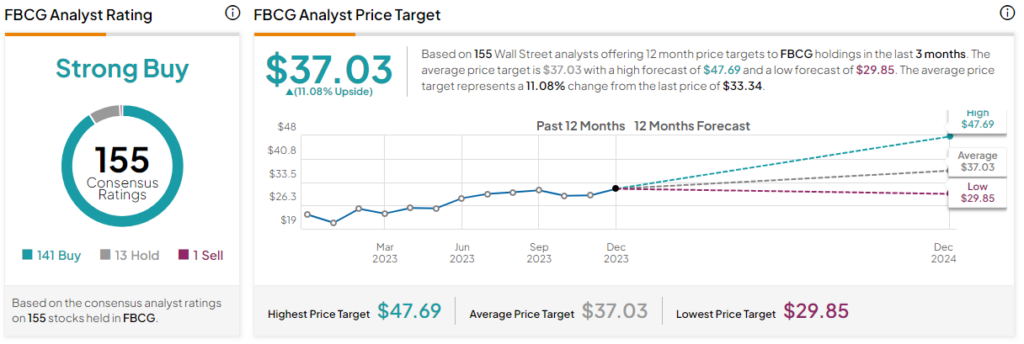
Meanwhile, FBCG earns a Moderate Buy consensus rating based on 141 Buys, 13 Holds, and one Sell rating assigned in the past three months. The average FBCG stock price target of $37.03 implies 11.1% upside potential.
Head-to-Head Performance
FBCG only launched in 2020, so we can’t compare the performance of these two ETFs over a very long time frame. That said, we can compare how they’ve done over the past three years, and there is a clear winner here. FBCG has generated an annualized return of 5.2% over the past three years, while ARKK has lost 25.1% annually.
And the Winner Is…
Both of these funds have delivered spectacular results to their investors in 2023. Going forward, FBCG looks like the better choice for investors based on the strength of its portfolio, which TipRanks’ Smart Score system views more favorably than ARKK’s, its superior performance over the past three years, and its lower expense ratio.