


ROM
ProShares Ultra Technology
$117.27
ROM Holdings: Top Stocks & Sector Breakdown
Last updated: November 13, 2026
- Holdings Count
- 85
- Total Assets
- 1.06B
- Top 10 Percentage
- 45.08%
- Asset Class
- Equity
- Category
- Sector
- Region
- North America
Market Cap
Smart Score
Price Target Upside
Analyst Consensus
Yearly Gain
Top Holdings
85 Holdings as of Nov 13, 2026
| Name | Weight % | Market Value | Price & Change | Market Cap | Yearly Gain | Analyst Consensus | Analyst Price Target | Smart Score | Follow |
|---|---|---|---|---|---|---|---|---|---|
| AAPLApple Inc | 11.14% | $113.66M | ― | $5.18T | 30.53% | Moderate Buy | $345.57 | ||
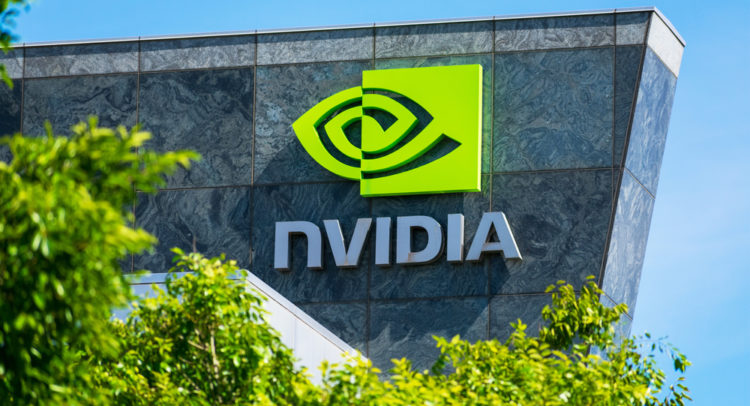
| NVDANvidia Corporation | 8.45% | $86.15M | ― | $3.92T | -12.85% | Moderate Buy | $235.35 | ||
| MSFTMicrosoft | 8.34% | $85.04M | ― | $3.89T | 4.09% | Strong Buy | $632.48 | ||
| AVGOBroadcom Inc. | 3.54% | $36.09M | ― | $1.66T | 2.07% | Strong Buy | $517.71 | ||
| AMDAdvanced Micro Devices, Inc. | 3.38% | $34.50M | ― | $875.91B | 115.38% | Strong Buy | $652.18 | ||
| IQMMIQMM | 3.14% | $32.04M | ― | ― | ― | ― | ― | ||
| MUMicron Technology | 2.50% | $25.50M | ― | $880.60B | 228.47% | Strong Buy | $1,624.42 | ||
| PLTRPalantir Technologies Inc. | 1.68% | $17.11M | ― | $404.77B | -2.41% | Moderate Buy | $230.59 | ||
| CSCOCisco | 1.64% | $16.68M | ― | $376.53B | 23.60% | Moderate Buy | $130.07 | ||
| INTCIntel | 1.29% | $13.12M | ― | $317.09B | 66.14% | Hold | $90.93 |
Sector Breakdown
- Technology90.27%
- General9.73%
Countries Breakdown
- United States100.00%
Breakdown By Smart Score
- 108.27%
- 924.93%
- 819.66%
- 728.35%
- 61.87%
- 52.11%
- 414.32%
- 30.09%
- 20.29%
- 10.10%
ROM ETF News





ROM ETF FAQ
What are ETF ROM’s top 3 holdings?
ROM’s top 3 holdings are AAPL, NVDA, MSFT.
What is ROM’s holding count?
ROM holds 85 assets.
What are the total assets of ETF ROM?
ROM’s total assets are $1.06B.
What sector is ROM most exposed to?
ROM’s largest sector exposure is Technology (90.27%).
How concentrated is ROM?
ROM’s top 10 holdings represent 45.08% of the fund.
