

Want to see TSE:GCN full AI Analyst Report?
Goldcliff Resource (GCN) AI Stock Analysis
Top Page
Goldcliff Resource
(TSXV:GCN)
Weak financial performance from zero revenue and cash burn is the dominant factor. Neutral technical indicators offer minimal offset, while negative P/E and lack of dividends further limit the score.
Goldcliff Resource (GCN) vs. iShares MSCI Canada ETF (EWC)
- Market Cap
- CAD 1.57M
- Dividend Yield
- ―
- Average Volume (3M)
- 100.55K
- Price to Earnings (P/E)
- -6.4
- Beta (1Y)
- 1.32
- Revenue Growth
- ―
- EPS Growth
- 25.49%
- Country
- Canada
- Employees
- 0
- Sector
- Basic Materials
- Sector Strength
- 61
- Industry
- Other Precious Metals
Goldcliff Resource Business Overview & Revenue Model
Company Description
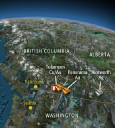
Goldcliff Resource Corporation engages in the acquisition, evaluation, and exploration of assets in Canada and the United States. It primarily explores gold, silver, and copper deposits. The company holds interests in the Ainsworth silver project loc...
How the Company Makes Money
Goldcliff Resource does not have publicly available information indicating recurring revenue from mineral production or operating assets; therefore, its ongoing cash generation from operations is not evident. Typical monetization pathways for an earl...
Goldcliff Resource Financial Statement Overview
Summary
Zero revenue, TTM net loss of ~$298,000, and deeply negative cash flows indicate weak financial performance, partially offset by positive equity near $1.58 million.
Income Statement
22NegativeBalance Sheet
38NegativeCash Flow
18Very Negative| Breakdown | TTM | Jan 2026 | Jan 2025 | Jan 2024 | Jan 2023 | Jan 2022 |
|---|---|---|---|---|---|---|
Income Statement | ||||||
| Total Revenue | 0 | 0 | 0 | 0 | 0 | 0 |
| Gross Profit | 0 | 0 | -33.82K | 0 | -549.00K | -451.00K |
| EBITDA | -497.59K | -400.47K | -231 | -87.87K | -389.17K | -629.00K |
| Net Income | -297.68K | -361.30K | -288.00K | -364.00K | -1.24M | -814.00K |
Balance Sheet | ||||||
| Total Assets | 1.58M | 1.60M | 1.19M | 921.25K | 853.85K | 1.39M |
| Cash, Cash Equivalents and Short-Term Investments | 221.62K | 227.44K | 90.81K | 63.91K | 206.36K | 869.79K |
| Total Debt | 980.00K | 1.03M | 570.00K | 175.00K | 175.00K | 0 |
| Total Liabilities | 1.02M | 1.20M | 671.87K | 293.16K | 238.14K | 85.28K |
| Stockholders Equity | 565.67K | 401.40K | 521.65K | 628.09K | 615.71K | 1.30M |
Cash Flow | ||||||
| Free Cash Flow | -346.76K | -368.54K | -538.30K | -235.02K | -888.29K | -989.05K |
| Operating Cash Flow | -346.76K | -368.54K | -289.46K | -235.02K | -753.16K | -817.57K |
| Investing Cash Flow | -80.75K | -200.79K | -248.84K | -227.87K | -133.30K | -153.76K |
| Financing Cash Flow | 688.93K | 776.31K | 532.20K | 389.19K | 553.03K | 387.90K |
Goldcliff Resource Technical Analysis
Price Trends
Market Momentum
Evaluating momentum and price trends is crucial in stock analysis to make informed investment decisions. For TSE:GCN, the sentiment is Negative. The current price of 0.03 is below the 20-day moving average (MA) of 0.03, below the 50-day MA of 0.03, and below the 200-day MA of 0.04, indicating a bearish trend. The MACD of -0.00 indicates Positive momentum. The RSI at 21.43 is Positive, neither overbought nor oversold. The STOCH value of 0.00 is Positive, not indicating any strong overbought or oversold conditions. Overall, these indicators collectively point to a Negative sentiment for TSE:GCN.
Goldcliff Resource Peers Comparison
Overall Rating
 TSE:TRG47Neutral
 TSE:ZFR45Neutral
 TSE:WINS43Neutral
 TSE:GSRI42Neutral
- TSE:GCN41Neutral
 TSE:NXS39Underperform
Financial Indicators
| Name | Overall Rating | Market Cap | P/E Ratio | ROE | Dividend Yield | Revenue Growth | EPS Growth |
|---|---|---|---|---|---|---|---|
| Sector * | 61Neutral | $10.43B | 7.12 | -0.05% | 2.87% | 2.86% | -36.73% |
| TSE:TRG | 47Neutral | CAD 3.58M | 9.68 | 11.13% | ― | ― | ― |
| TSE:ZFR | 45Neutral | CAD 7.46M | -22.38 | -5.75% | ― | ― | -34.78% |
| TSE:WINS | 43Neutral | CAD 5.21M | -1.60 | -149.04% | ― | ― | 28.81% |
| TSE:GSRI | 42Neutral | CAD 4.46M | -2.45 | -59.87% | ― | ― | 58.61% |
| TSE:GCN | 41Neutral | CAD 2.02M | -6.41 | -51.35% | ― | ― | 25.49% |
| TSE:NXS | 39Underperform | CAD 3.00M | -0.23 | 3359.69% | ― | ― | -892.33% |
* Basic Materials Sector Average
Performance Comparison
| Show on chart | Ticker | Company Name | Price | Change | % Change |
|---|---|---|---|---|---|
| TSE:GCN | Goldcliff Resource | 0.03 | -0.03 | -54.55% | |
| TSE:WINS | Winshear Gold Corp. | 0.07 | -0.03 | -25.00% | |
| TSE:NXS | Nexus Gold | 0.13 | -0.04 | -21.88% | |
| TSE:ZFR | Zephyr Minerals | 0.08 | 0.02 | 33.33% | |
| TSE:TRG | Tarachi Gold Corp. | 0.03 | -0.01 | -14.29% | |
| TSE:GSRI | Golden Shield Resources Inc. | 0.20 | -0.14 | -40.58% |
Goldcliff Resource Corporate Events
Goldcliff Raises $100,000 in Flow-Through Financing for Kettle Valley Drilling
PositiveGoldcliff Resource Corporation has closed the first tranche of a non-brokered private placement, issuing 2,000,000 flow-through shares for gross proceeds of $100,000 to fund drilling at its Kettle Valley exploration project in British Columbia. The f...
Goldcliff Launches $600,000 Private Placement to Fund B.C. Gold-Silver Exploration
PositiveGoldcliff Resource Corporation plans to raise up to $600,000 through a non-brokered private placement comprising non-flow-through units and flow-through shares offered under the Listed Issuer Financing Exemption across most Canadian provinces. The fi...
Goldcliff outlines new East Breccia gold-silver zone at Kettle Valley
PositiveGoldcliff Resource Corporation has identified a new gold-silver mineralized East Breccia Zone within the North Cliff Zone at its Kettle Valley project in British Columbia, following follow-up work on a May surface rock sampling program. Assays from a...
Disclaimer
This AI Analyst Stock Report is automatically generated by our AI systems using advanced algorithms and publicly available financial, technical, and market data. While the information provided aims to be accurate and insightful, it is intended for informational purposes only and should not be considered financial advice. Any content created by an AI (Artificial Intelligence) system may contain inaccuracies and/or contain errors. Investing in stocks carries inherent risks, and past performance is not indicative of future results. This report does not account for your personal financial circumstances, objectives, or risk tolerance. Always conduct your own research or consult with a qualified financial advisor before making investment decisions. The analysis and recommendations provided are based on historical and current data and may not fully reflect future market conditions or unexpected developments. Neither the creators of this report nor its affiliated entities guarantee the accuracy, completeness, or reliability of the information presented. Use this report at your own discretion and risk.
Date of analysis: Sep 27, 2026