


Thryv Holdings earnings date
Want to see THRY full AI Analyst Report?
Thryv Holdings (THRY) Q3 2026 Earnings Report
THRY Q3 2026 EPS Results
- Actual EPS
- -$2.32
- Consensus EPS
- -$0.16
- Beat/Miss
- Missed by -$2.16
- One Year Ago EPS
- $0.13
THRY Q3 2026 Revenue Results
- Actual Revenue
- $118.94M
- Expected Revenue
- $145.67M
- Beat/Miss
- Missed by -$26.73M
- YoY Revenue Growth
- -40.99%
Earnings Announcement Details
- Quarter
- Q3 2026
- Date
- 11/09/2026
- Time
- After Close
- Conference Call
- Monday, November 9, 2026
Thryv Holdings's next earnings date is estimated for February 25, 2027, based on past reporting schedules.
Q3 2026 Earnings Call Audio
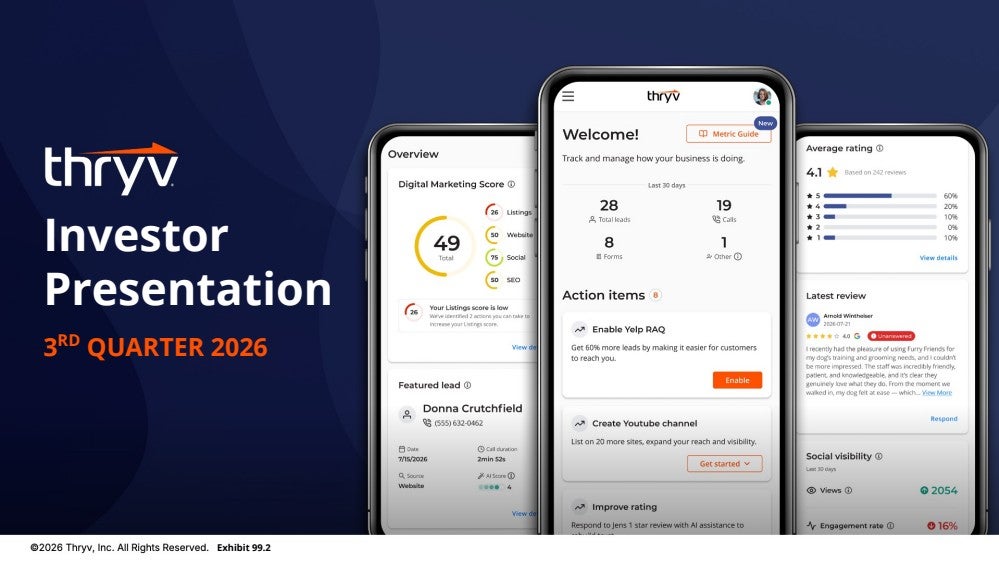
Q3 2026 Earnings Slide Deck
Q3 2026 Earnings Call Summary
The call was broadly positive about the new AI-centered growth platform, with sales at approximately 190% of plan, 16% year-over-year growth in growth products, improving SaaS margins, higher ARPU, and expected balance-sheet benefits from the print sale. However, the near-term outlook includes revenue headwinds from exiting legacy businesses, restructuring-related reporting effects, negative Marketing Services EBITDA, a goodwill impairment, negative fourth-quarter SaaS adjusted EBITDA guidance, and lower full-year SaaS guidance. Highlights significantly outweighed the stated challenges, although management characterized the fourth quarter as messy during the transition.
For the fourth quarter, Marketing Services revenue is expected in the range of $2 million to $3 million and Marketing Services adjusted EBITDA in the range of negative $11 million and negative $12 million; for the full year, Marketing Services revenue is expected in the range of $35 million to $36 million and Marketing Services adjusted EBITDA in the range of negative $21 million and negative $22 million. For the fourth quarter, SaaS revenue is expected in the range of $110 million to $111 million and SaaS adjusted EBITDA in the range of negative $4.5 million and negative $5.5 million; for the full year, SaaS revenue guidance is a range of $453 million to $454 million and SaaS adjusted EBITDA guidance is a range of $16.5 million to $17.5 million. The reduction plan is expected to impact R&D in the quarter to the tune of a few million, the restructuring plan will run from the middle of this year to the middle of 2027, the remaining marketing services customers will either be upgraded to the software platform or cease to be customers in 2027, and the business will cease to be a reporting segment for the second half of 2027.
- Third-Quarter Results Beat GuidanceManagement described the third quarter as solid and said the company beat guidance. On a like-for-like basis, SaaS adjusted EBITDA exceeded third-quarter guidance by more than $5 million.
- Successful Thryv Growth Platform LaunchThe Thryv growth platform launched in August and was described as the most successful launch in company history to date. Approximately 1,500 growth platforms had been sold, representing about 190% of plan.
- Strong Customer Results From Growth ProductsIn Thryv's 2026 study, customers saw a 54% increase in online visibility, 54% more reviews, and 40% more leads. Growth products increased 16% year-over-year in the most recent quarter.
- Growth Products Represent More Than Half of SaaS RevenueGrowth products represented around 60% or more of total SaaS revenue, although the quarter also included older Marketing Center products. Management said growth products have delivered strong double-digit growth for 13 straight quarters.
- AI-Centered Product and Sales InvestmentsThe company is concentrating investment on growth products built with AI at their core. ThryvCap is being deployed to give sales representatives a customer view and prepared plan before each conversation.
- Partnership Strategy ExpandedPartnerships were identified as the next lever for growth, with Robin Brenner appointed as Head of Partnerships. Thryv is working with companies that already serve small businesses, is partnering with Wix to provide payments capabilities, and is using a CRM-agnostic approach that connects with other CRM systems.
- Print Business Sale Expected to Accelerate Cash GenerationThe sale of the Print directories business to Carrollwood LP for $142 million is expected to close in the fourth quarter. Thryv said it had collected approximately $150 million through September against a prior forecast of $250 million to $300 million of unlevered free cash flow from print between 2025 and 2030; the sale would bring the total to roughly $292 million in about 24 months instead of six years.
- Clean Print Exit and Balance-Sheet BenefitsManagement said the print transaction has no earn-out, retained stake, or tail obligations, while Thryv will retain search properties including YP.com, Dex Nos, and Super Pages. Net proceeds after transaction costs and closing adjustments are expected to improve the balance sheet through debt and other liability repayment.
- SaaS Revenue and Profitability MetricsThird-quarter SaaS revenue was $112 million, at the top of guidance. SaaS adjusted gross margin was 69.3%, adjusted EBITDA was $9.5 million, and year-to-date adjusted EBITDA was $22.1 million.
- Improved SaaS EBITDA MarginsSaaS EBITDA margins were 8% for the third quarter and 6% year-to-date in 2026, compared with 5% for both periods in 2025.
- Higher ARPU and Improved Customer MixSaaS average revenue per user was $373, up 2% year-over-year, and the company ended the quarter with 98,000 SaaS subscribers. Quality clients accounted for 72% of revenue, an increase of 300 basis points year-over-year.
- Positive Cash Flow and Leverage MetricsThe company generated $4.7 million of free cash flow in the third quarter and $16 million year-to-date. Net debt was $236 million, and the leverage ratio was 2.5x.
- Planned Streamlining Toward a Pure-Play Software BusinessManagement said the company is reducing headcount and systems as part of its restructuring plan and expects margins to expand as soon as the beginning of 2027. The company expects to be a simpler, leaner, more focused software business after the print separation.
THRY Earnings History
| Report Date | Fiscal Quarter | Forecast / EPS | Last Year's EPS | EPS YoY Change | Press Release |
|---|---|---|---|---|---|
| Feb 25, 2027 | 2026 (Q4) | -0.54- | -0.22 | ― | ― |
| Nov 09, 2026 | 2026 (Q3) | -0.16-2.32 | 0.13 | -1884.62% (-2.45) | |
| Aug 04, 2026 | 2026 (Q2) | -0.10-0.38 | 0.31 | -222.58% (-0.69) | |
| Apr 30, 2026 | 2026 (Q1) | -0.060.10 | -0.22 | 145.45% (+0.32) | |
| Feb 26, 2026 | 2025 (Q4) | 0.18-0.22 | 0.19 | -215.79% (-0.41) | |
| Oct 30, 2025 | 2025 (Q3) | 0.250.13 | -2.65 | 104.91% (+2.78) | |
| Jul 30, 2025 | 2025 (Q2) | 0.290.31 | 0.15 | 106.67% (+0.16) | |
| May 01, 2025 | 2025 (Q1) | -0.14-0.22 | 0.22 | -200.00% (-0.44) | |
| Feb 27, 2025 | 2024 (Q4) | -0.150.19 | -7.39 | 102.57% (+7.58) | |
| Nov 07, 2024 | 2024 (Q3) | ―-2.65 | -0.78 | -239.74% (-1.87) |
The table shows recent earnings report dates and whether the forecast was beat or missed. See the change in forecast and EPS from the previous year.
